Page Not Found
Page not found. Your pixels are in another canvas.
A list of all the posts and pages found on the site. For you robots out there is an XML version available for digesting as well.
Page not found. Your pixels are in another canvas.
About me
This is a page not in th emain menu
Published:
To be written.
Published:
Bonjour, everyone! Time feels like it’s slipping away faster than ever these days. With paternity leave in full swing, finding work hours here and there has been a challenge (and honestly, it’s hard not to get distracted by Baby Finn’s cuteness). Despite the chaos, I’ve managed to make a major leap forward in the project: transitioning from Detectron2 Mask R-CNN to YOLOv8. Let me tell you—it’s been a game-changer.
From the start, YOLOv8 results were much crisper and more reliable than what I was achieving with Mask R-CNN. One of the issues I faced with Mask R-CNN was the finicky tuning of anchor sizes, which felt like a never-ending battle. I experimented endlessly, defining anchors in different ways, but the results always plateaued. In contrast, YOLOv8 just worked. The transition itself wasn’t too bad, though I had to tweak the input formats for images and labels since the two frameworks handle masks differently. Once that hurdle was cleared, training a YOLOv8 model on the dataset published in my previous article was a breeze.
Focusing on the freshest impact craters on the Moon, I used YOLOv8 to run predictions around these sites and quickly added new labels based on the output. Of course, this meant revisiting my edge-artifact problem from earlier (again!). This time, I found an excellent GitHub repository—SAHI (https://github.com/obss/sahi) —and with a few tweaks, I implemented a much better method for handling predictions over large images. Problem solved!
With this setup, I could efficiently map boulders around fresh lunar impact craters, review the predictions, clean up false positives, and add any missing boulders. After a few months of refining this process, I now have 1,988,087 boulders mapped across 82 young and fresh lunar impact structures. Let that sink in—nearly 2 million boulders! To put that into perspective, manually mapping this dataset would have taken 5–10 years at best. This level of automation is truly a luxury, and it’s exciting to push the boundaries of what’s possible in planetary science.
While there are other great groups out there, like the team in Freiburg, Germany (credit where it’s due—they’re doing fantastic work too), I’m proud of how far we’ve come. This dataset is groundbreaking in its scale, and I’ve already re-trained the YOLOv8 model with these new labels to make it even better for future use by others.
The difficult part begins now: extracting meaningful patterns from this vast database. I’m investigating how target properties (like surface composition or crater size) influence boulder ejection patterns. It’s a challenging task to untangle these relationships, and progress has been slow. I’m currently drafting the manuscript and working on figures, but juggling parenthood and research has proven more complicated than I’d anticipated. Efficiency has never been more crucial!
The end of the project is looming—just around the corner, in fact. Thanks to an extension for my paternity leave, I’ll have until January 2025 to wrap everything up. These final months are going to be hectic, but I’m determined to finish strong.
That’s it for now—back to the manuscript (or diaper duty… it’s a toss-up). Take care, everyone! Cheerios! 😊
Published:
Let’s go!!! 🎉 After nearly two years of hard work, my first article for the BOULDERING project has been accepted in the Journal of Geophysical Research: Planets! You can check it out here. This has been a long road, but also an incredibly rewarding one. Over 33,000 boulders were collected across more than 750 tiles/images from three planetary bodies: Earth, Mars, and the Moon.
The dataset, including images, labeled boulder data, the model setup for the best-performing Mask R-CNN model, and its trained weights, is now publicly available on Zenodo:
While the model achieved human-like detection rates—average precision: 72%, recall: 64%—I’m still not completely satisfied with its generalization. Over the next few months, I plan to improve the machine learning code base, and I’m considering switching to YOLO. Early tests have shown that YOLO delivers superior results using the same dataset, so let’s see where this exploration takes me!
On the personal front, things have been busy with baby Finn’s arrival at the end of August, two weeks earlier than expected! Luckily, we had everything ready to go (phew!). Adjusting to parenthood has been a whirlwind, especially with sleepless nights, but it’s been such a joy.
Norway’s parental leave system is fantastic, giving us much-needed time to bond with Finn. I’ll be on paternity leave from April through August, and I’ve taken some extra holiday leave too. Work has understandably taken a back seat lately as we settle into life as new parents.
The move back to Norway from the US was quite the challenge, especially with Siri being heavily pregnant. We had to sell all our furniture, pack up our lives into countless suitcases (and a few precious framed paintings—2 out of 3 survived the journey!), and navigate international travel. Despite the chaos, the experience of living in the US was extraordinary. I’m so grateful to the Marie Skłodowska-Curie Fellowship program for making it possible.
I’ll miss the amazing colleagues, the sunny California weather, and the breathtaking nature. But at the same time, it feels good to be back in Europe—because, well, you can’t have it all! I’m keeping in touch with my Stanford colleagues, especially Mathieu. Fun fact: Brian, one of the undergraduates who worked on the project, is now publishing his own article comparing our boulder detection algorithm with rock abundance data from the DIVINER instrument onboard the Lunar Reconnaissance Orbiter. (Google it—super interesting stuff!)
Gotta run—Finn’s crying, and it’s my turn! Take care, everyone! 😊
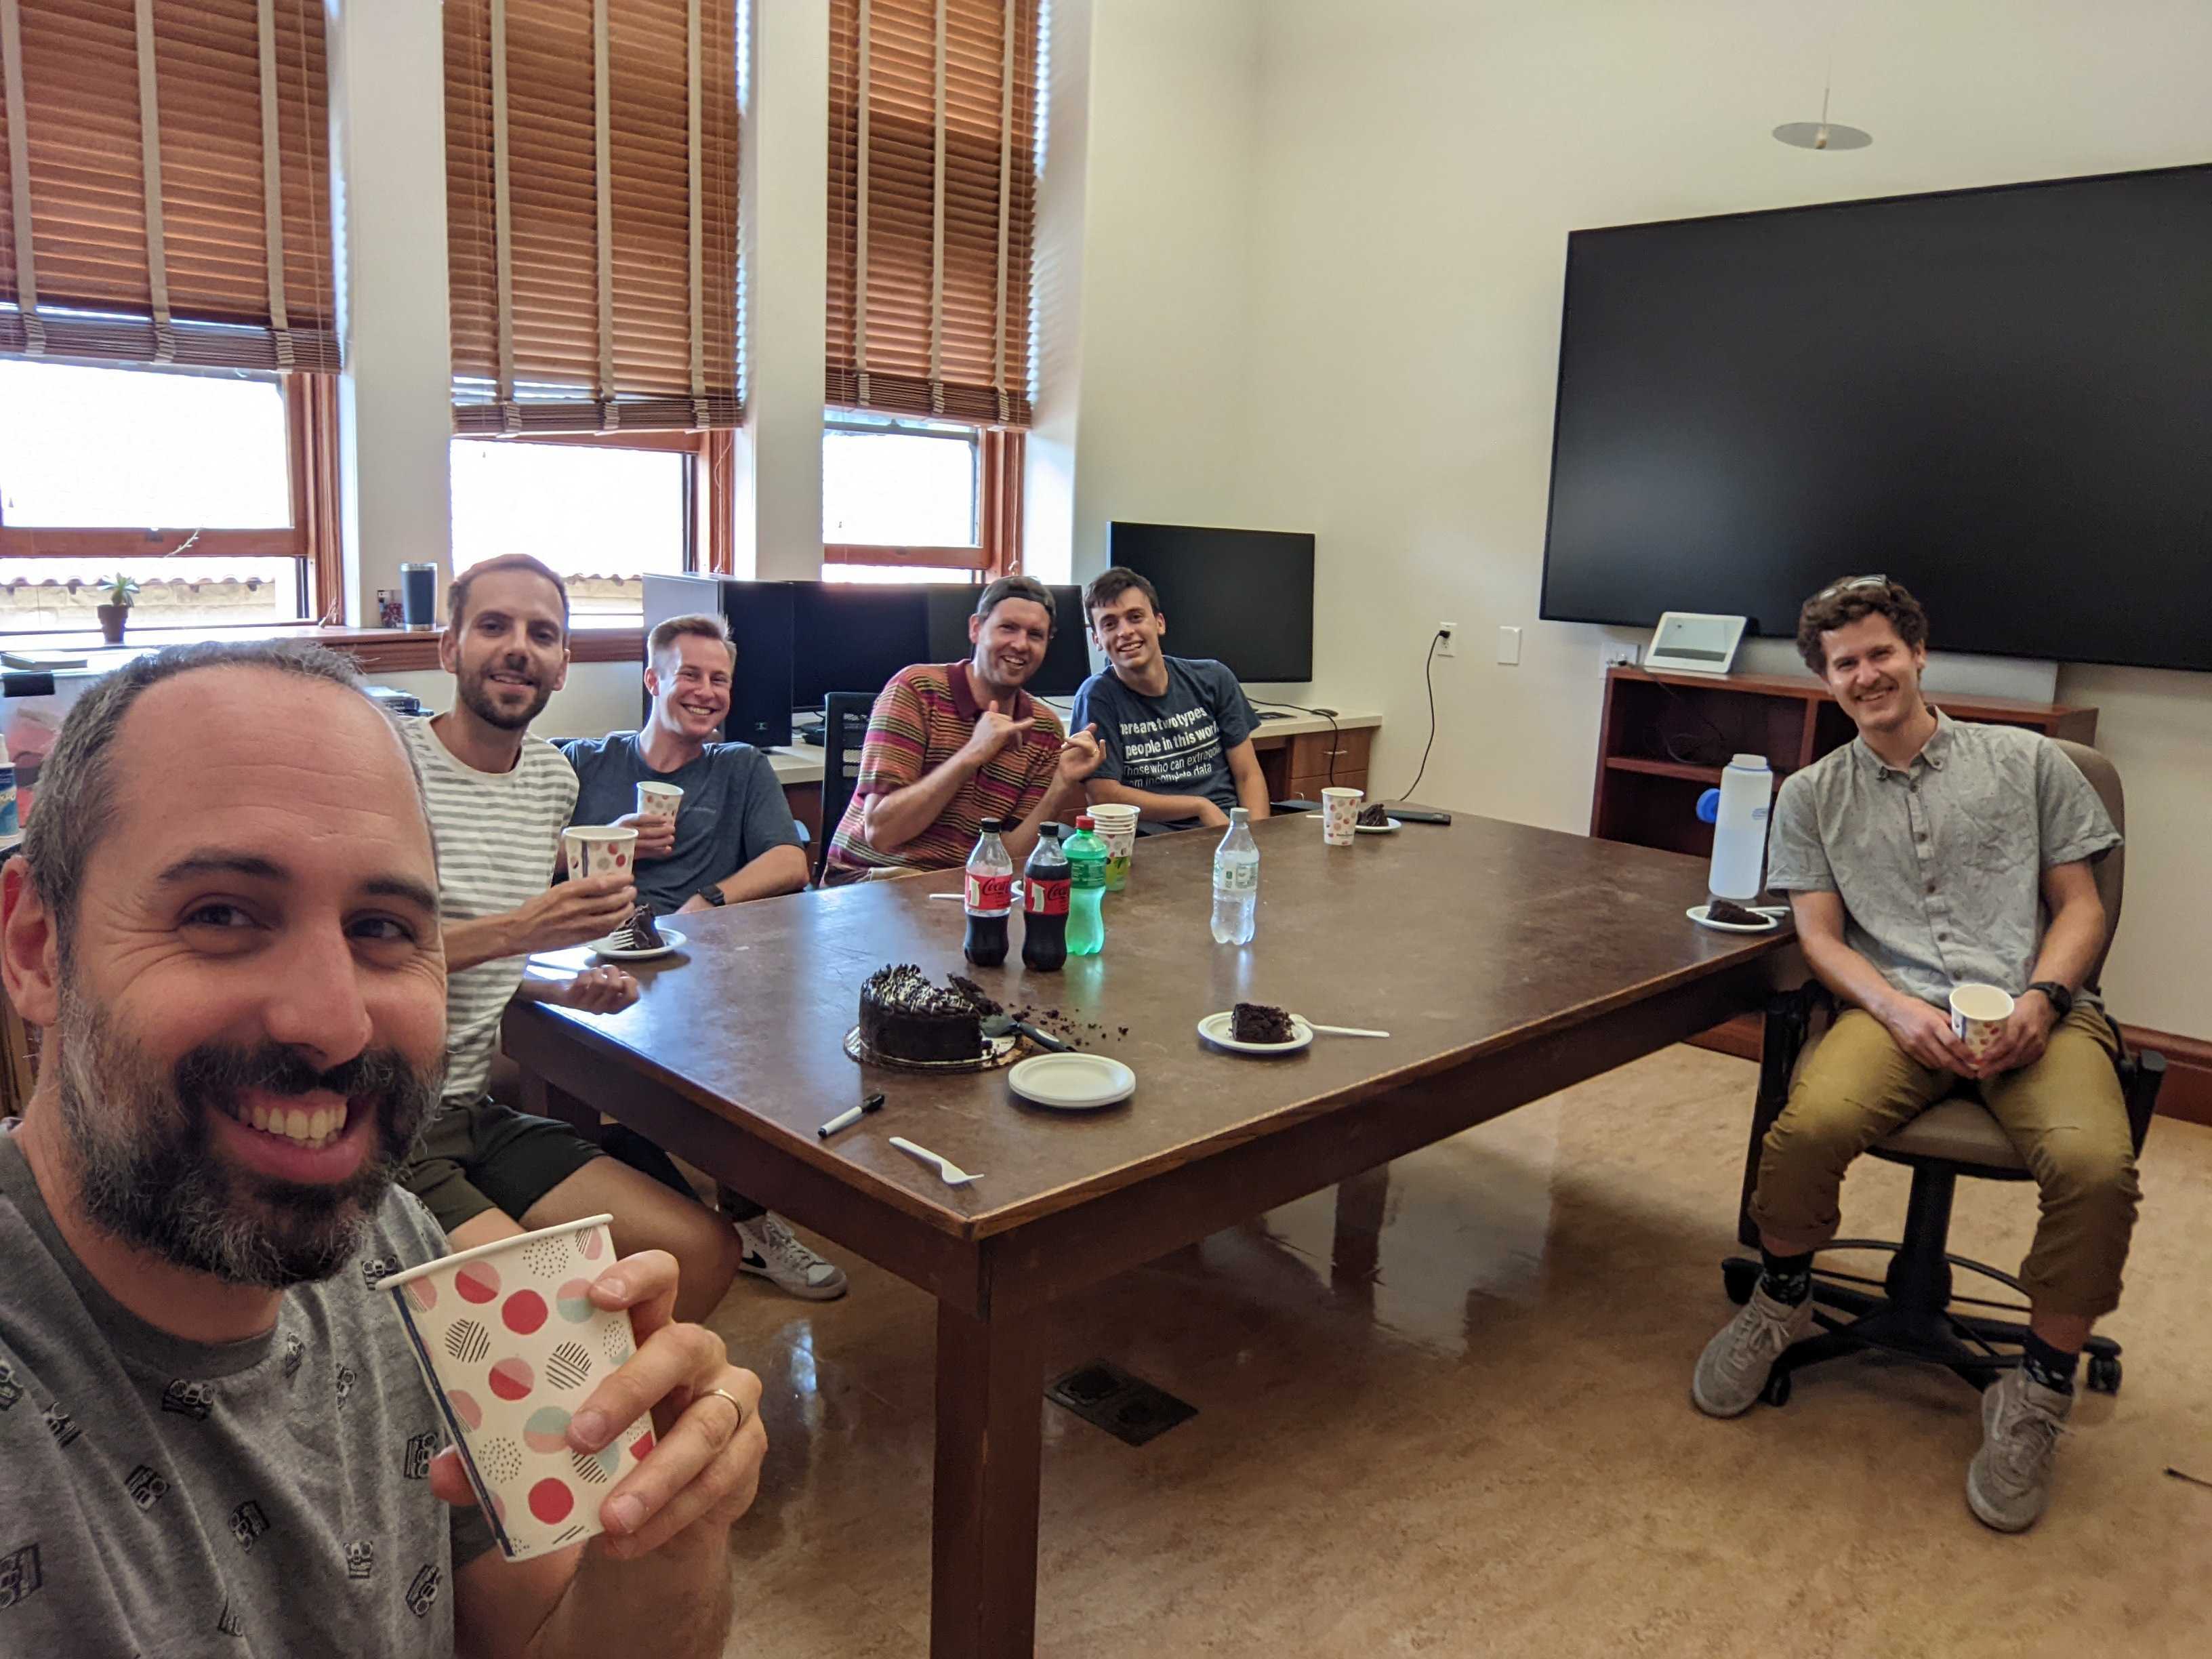 Caption: Nice atmosphere with colleagues during group meeting at Stanford. Miss you already guys!
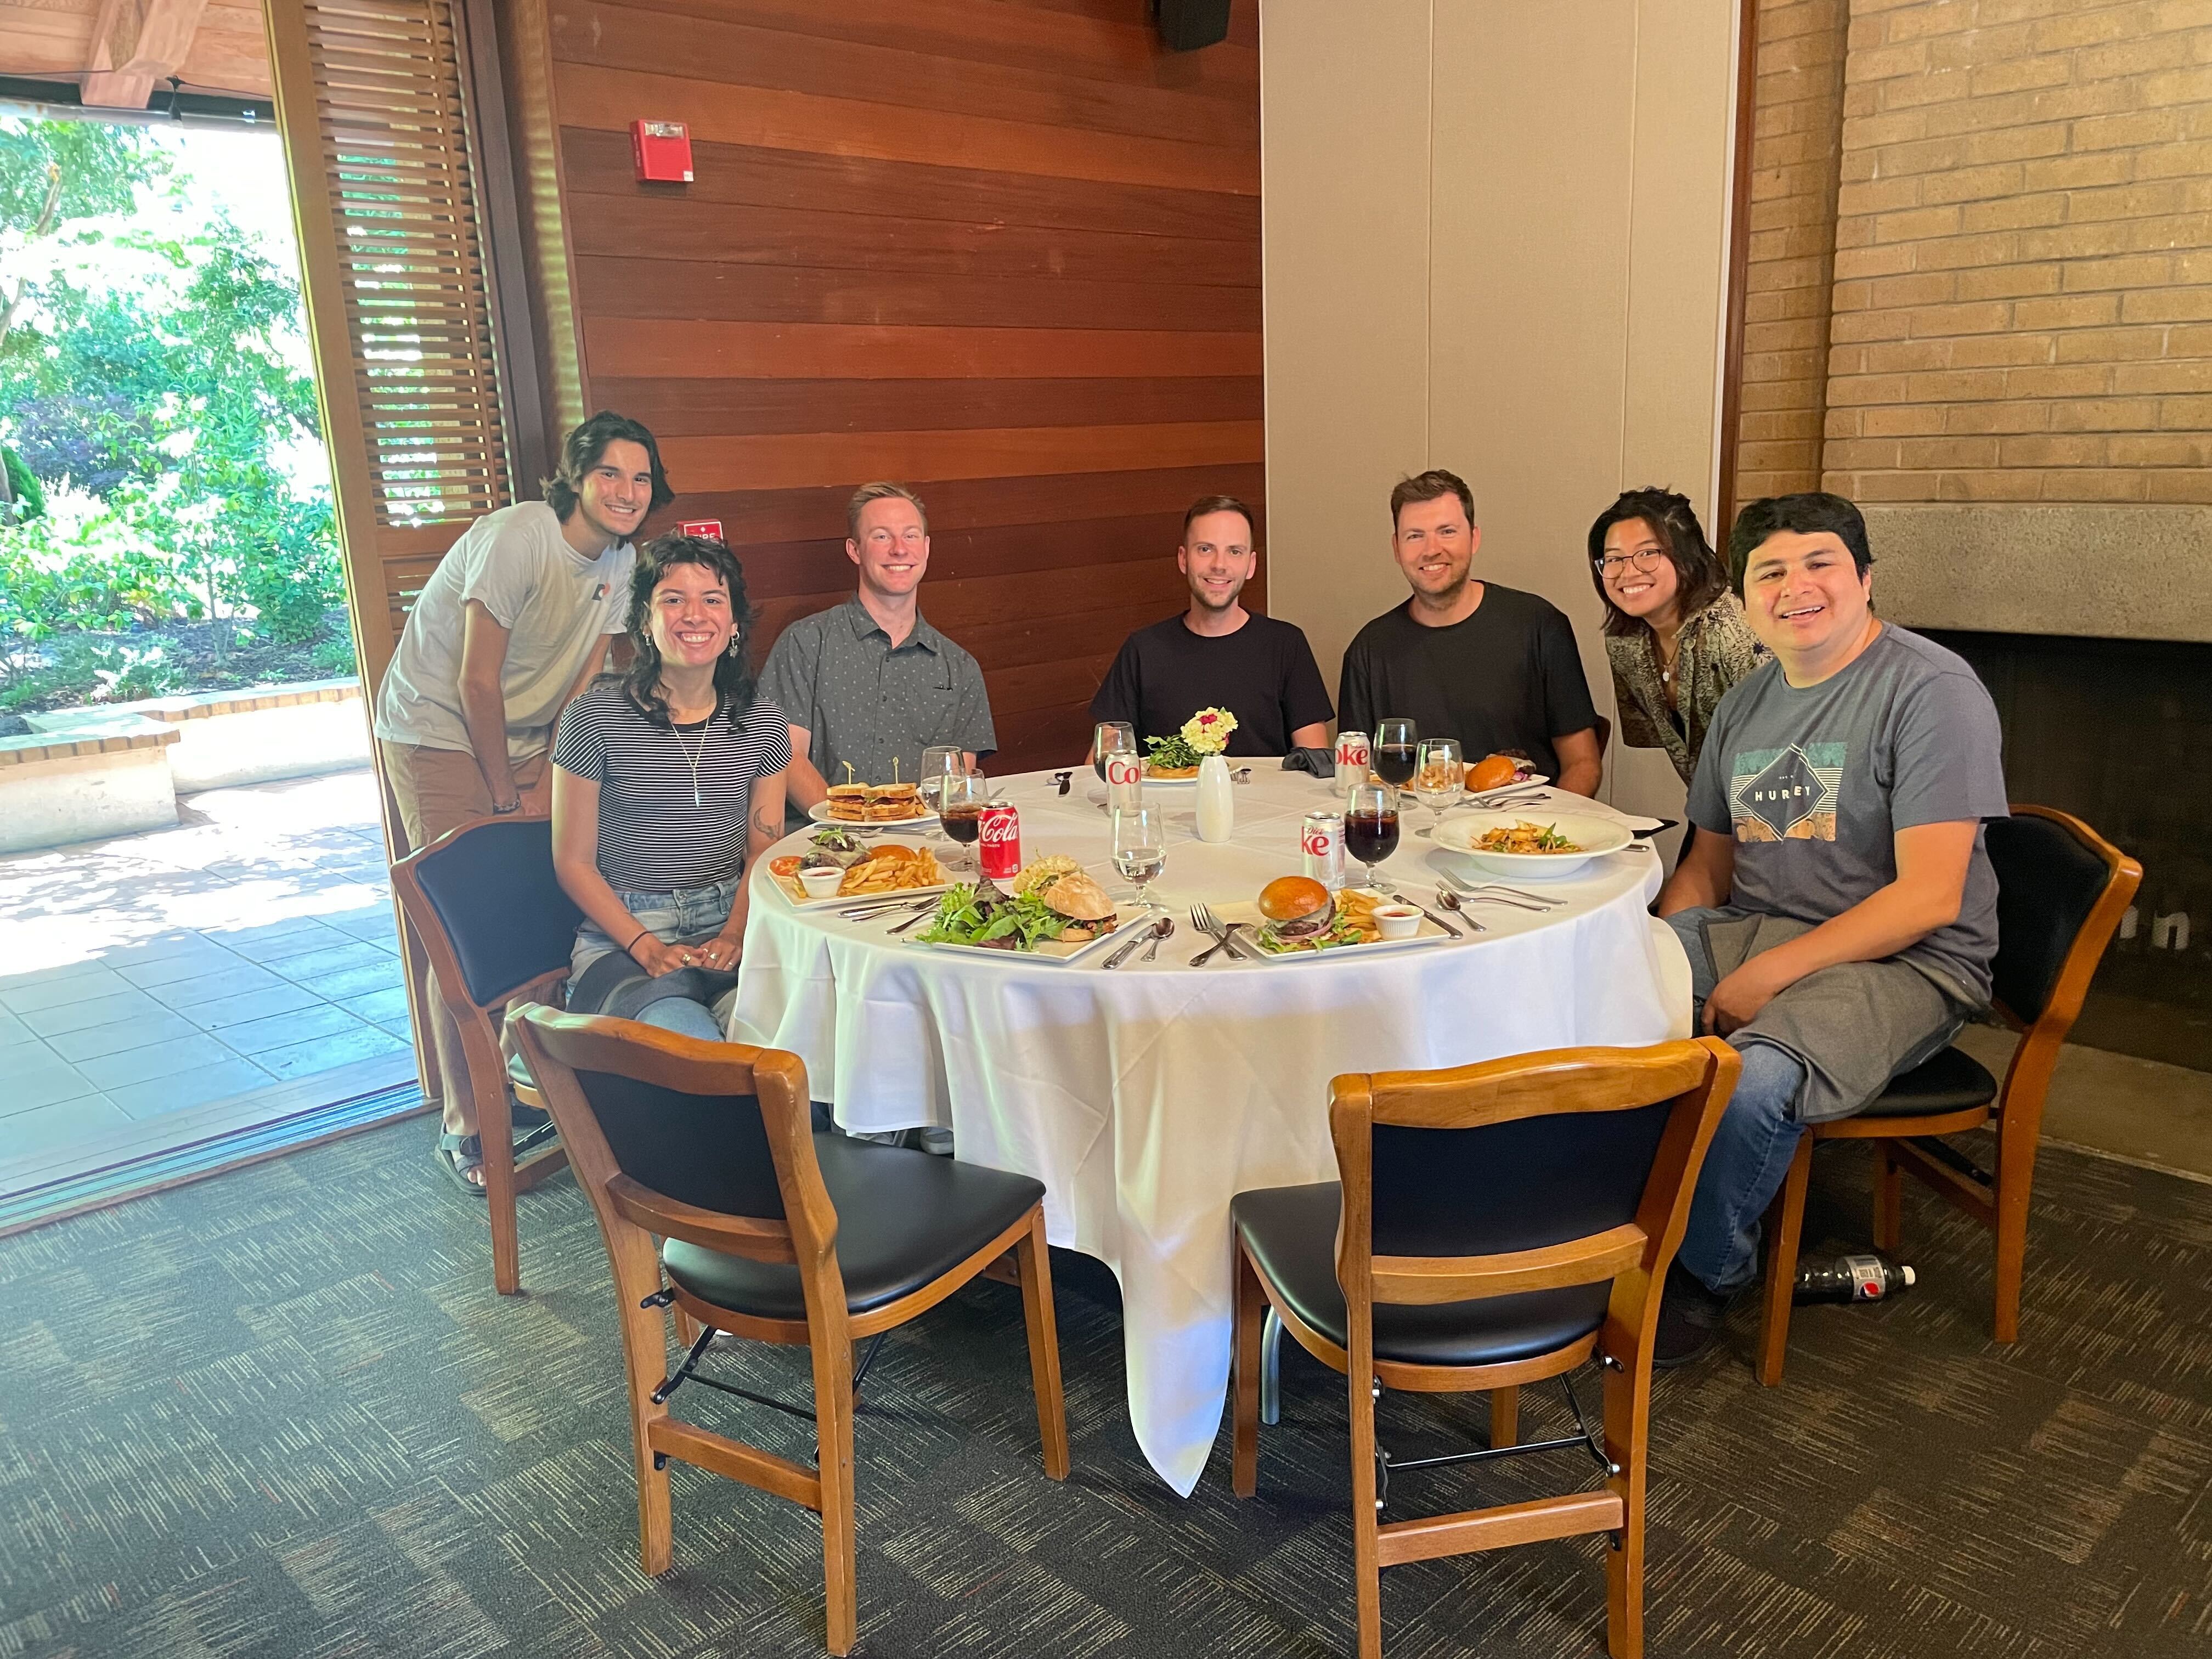 Caption: Goodbye party/lunch at the private restaurant at the campus! Thanks Mathieu.
Published:
Big life updates, everyone! Siri is now at Stanford! Thanks to a fantastic program from the Norwegian Research Council (NRC), postdocs already involved in NRC projects can apply for a research stay abroad for up to a year. The NRC covers the salary, and with a high success rate for these grants, it’s a great way to build international collaborations. After some searching, Siri found a group at Stanford doing work closely related to her research at NMBU in Ås. A few weeks of visa wrangling later, she’s here!
Having her here is a game-changer. Life without your partner by your side is tough—really tough. It’s such a relief to finally be in the same place, especially during our last few months in the US.
And here’s the biggest news: we’re expecting a baby boy in September! 🎉 While we’d love to stay longer, the logistics of giving birth in the US are… well, let’s say “challenging.” It can cost upwards of $50,000 (!), which is a hard no for us. Thankfully, in Norway, pregnancy care and childbirth are free of charge—as they should be. So, we’re adjusting our timeline and planning to head back to Norway in early July to avoid travel restrictions during late pregnancy.
On the professional front, my first article is finally taking shape, thanks to great feedback from Mathieu. Things are moving quickly now, and I’m aiming to submit it before summer. After that, I’m hoping to prepare things out for one more manuscript before Baby Boss arrives. With the clock ticking, I really need to get the ball rolling!
That’s it for now—lots of changes, but all very exciting. Take care, everyone. Talk soon! 😊
 Caption: Siri is baaaack in the US! So nice :)
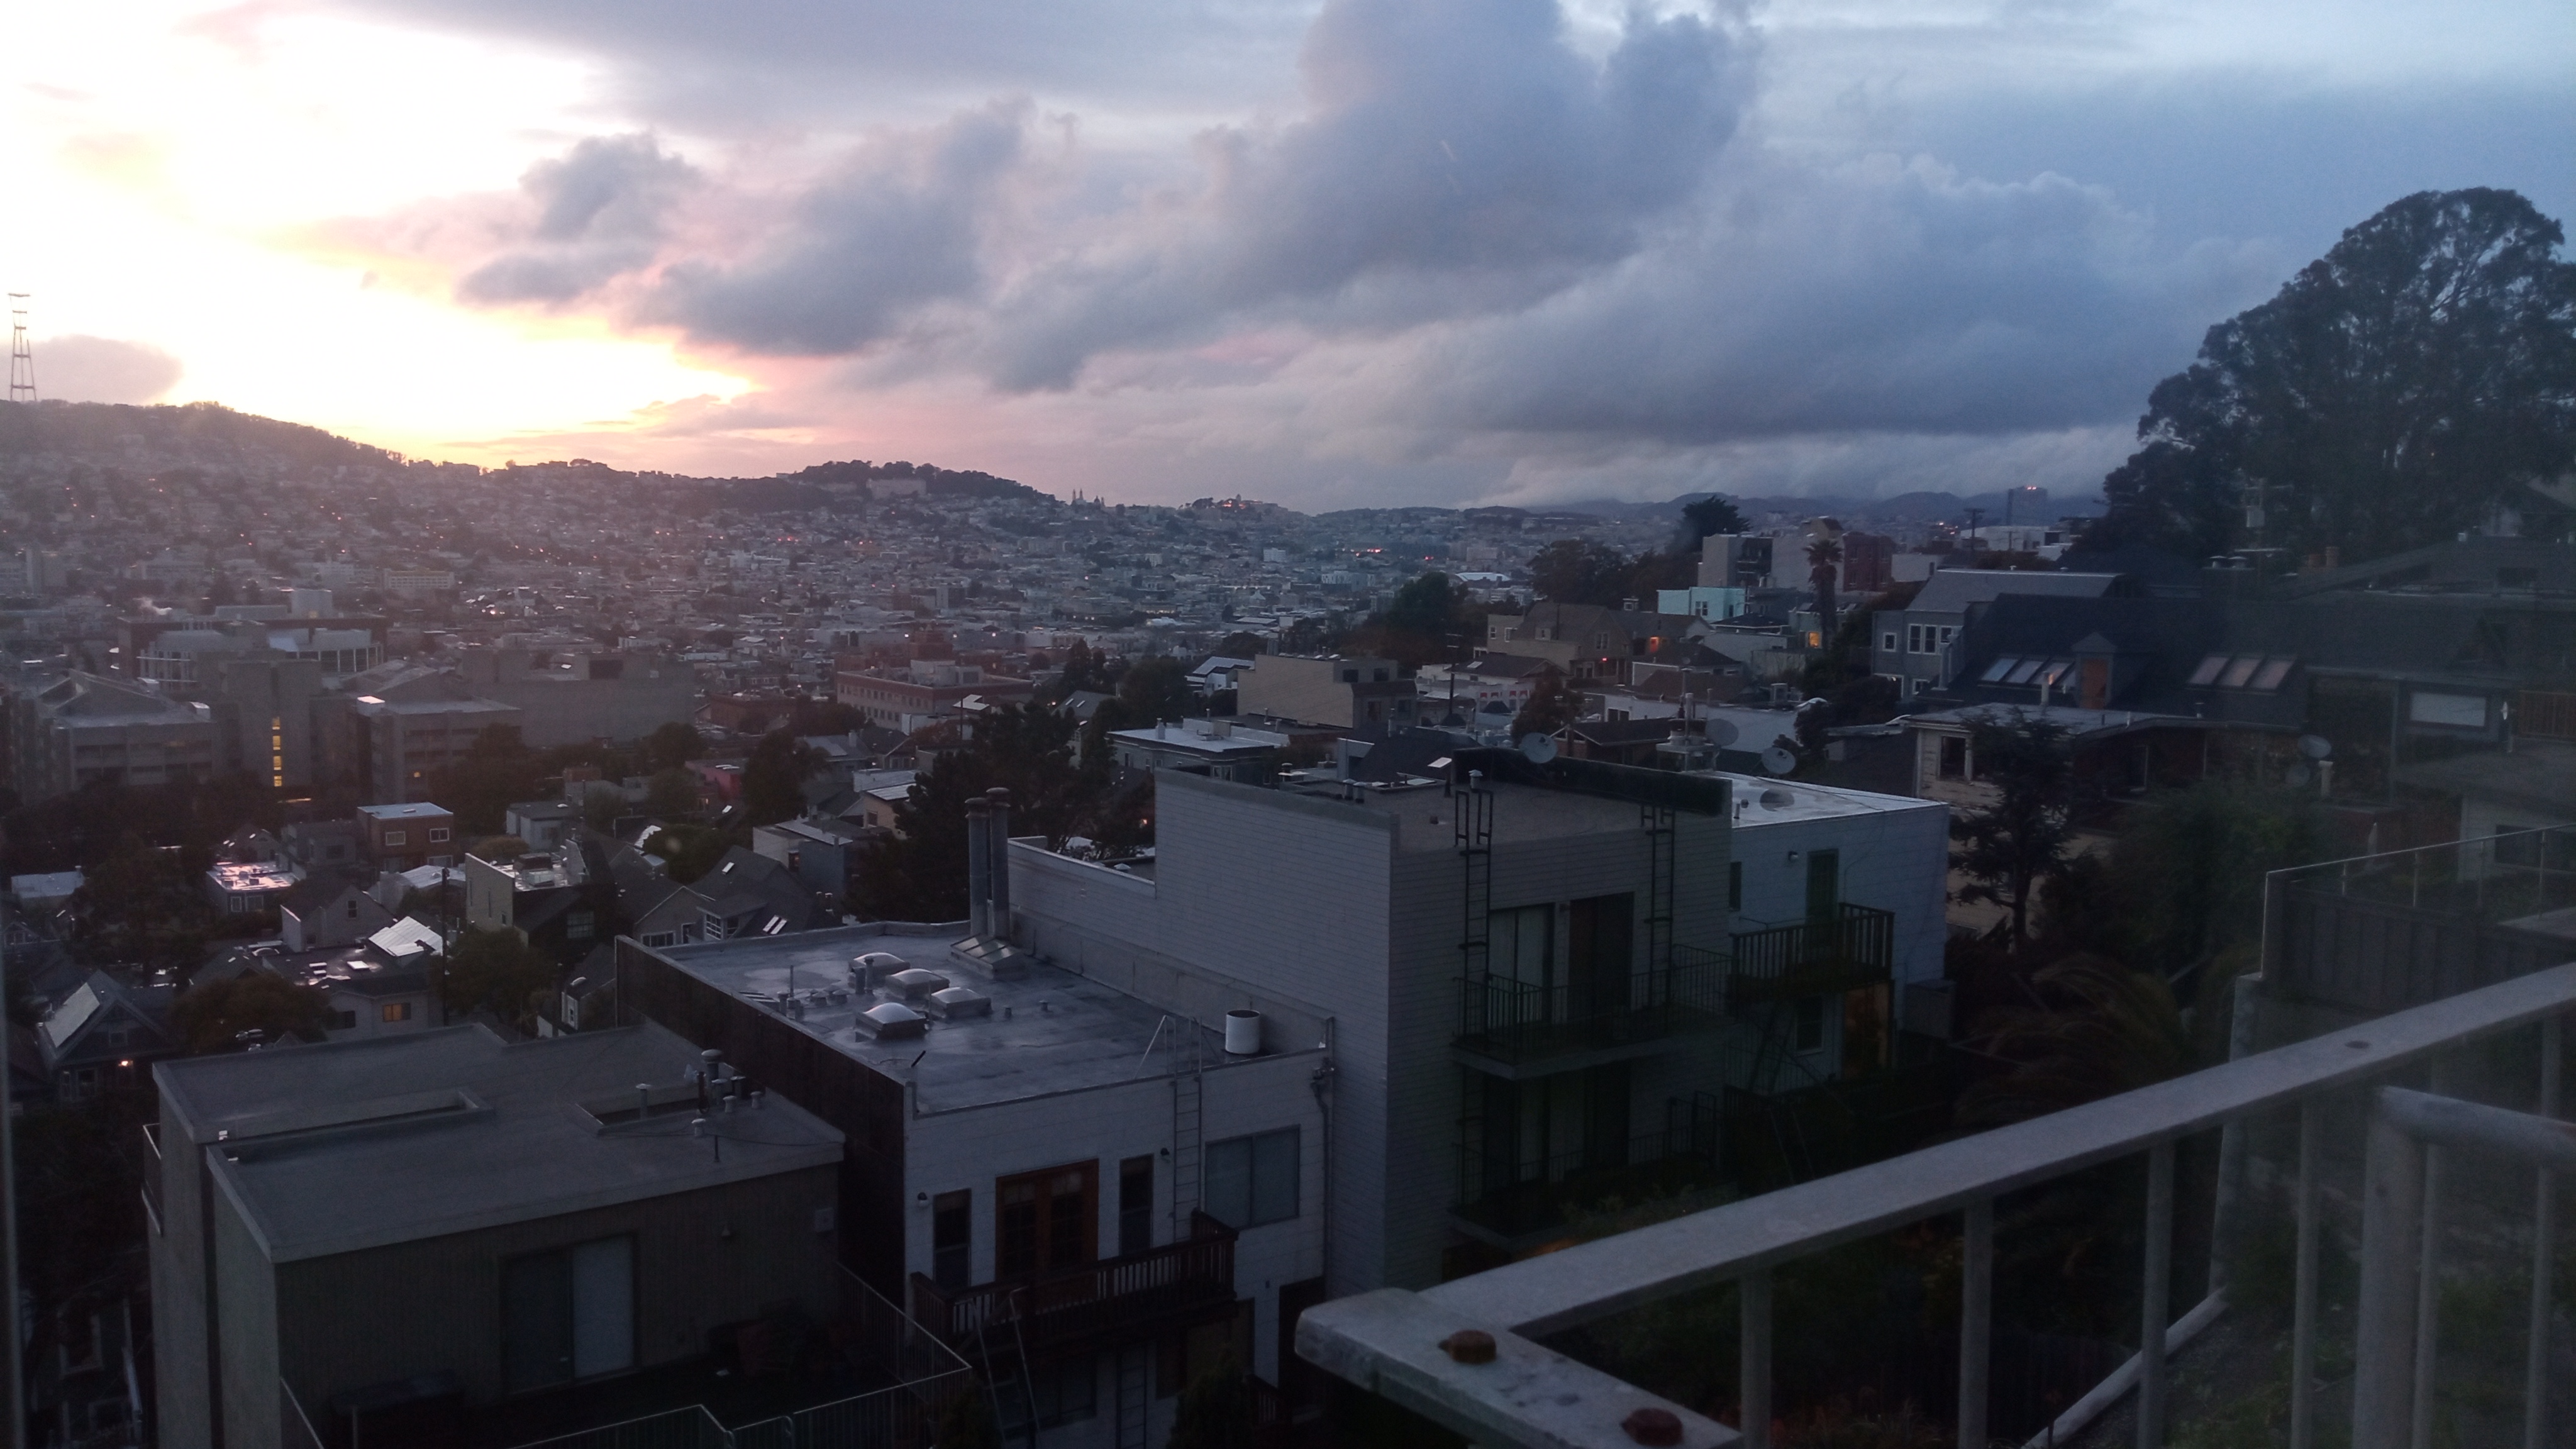 Caption: Photo of SF by night. We have been using more time to discover SF during the weekends.
Published:
Hey everyone! The past few months have felt like a game of two steps forward, one step back, but progress is happening—slowly but surely. Most of my time has been spent processing and fine-tuning the orthoimages collected during fieldwork and improving the prediction workflow for the Mask R-CNN model.
One tricky issue I tackled recently was dealing with edge artifacts in tiled images. Satellite images are enormous and need to be split into smaller tiles for analysis. The problem? Boulders at the edges of tiles often get their outlines chopped up in predictions. To fix this, I coded a system to run predictions on overlapping tiles and fetch edge predictions from adjacent tiles. While there are probably plenty of GitHub repositories with similar solutions, I wrote this part myself as a learning exercise. It’s time-consuming but rewarding—it’s not often you get the chance to build something from scratch when time constraints dominate most careers in research and consulting.
I’ve been training the Mask R-CNN model and getting reasonable results:
However, I’ve been a bit frustrated by the model’s ability to generalize to new images. To improve this, I’ve expanded the training dataset to include:
Earth
Moon About 70% of the training data comes from relatively young lunar impact craters, with varying illumination conditions. Emiliano and I worked hard on this dataset.
Mars A few images were mapped by Brian, focusing on Martian boulder populations.
To help the model generalize better, I’ve implemented a series of data augmentations, progressing through blocks of increasing complexity (thanks to a suggestion from David, a machine learning expert and old friend):
The model has reached a point where predictions are good enough to help expand the training dataset. After visual inspection, I’ve been correcting outlines, adding missing boulders, and removing false positives. It’s a slow process but ultimately rewarding because this step turns machine-generated data into high-quality labeled data.
The best part? All this work will culminate in a public dataset for the planetary science community. Researchers will be able to train their models without slogging through the tedious and time-consuming labeling process. I only ask that they remember to cite the article and dataset (please, and thank you!). 😊
Next on the agenda: producing plots, starting the first manuscript, and taking another big step forward. First paper, here I come! Cheers, everyone—thanks for following along! 🎉
Published:
Hey everyone! The second part of the BOULDERING drone campaign is in the books, and what a special experience it was—this time, I had my parents as my field assistants! They visited me for three weeks in September, and I thought this would be the perfect chance to show them not just the incredible landscapes of California but also what I actually do in my research (fieldwork edition).
We kicked things off with an amazing 2–3 days exploring Yosemite National Park. From towering granite cliffs to serene meadows, it was the perfect way to set the tone for the trip. After Yosemite, we drove south to Fresno for a night’s rest, then set out early the next morning for Courtright Reservoir.
The drive was… let’s say, an adventure. Driving over the top of the dam felt surreal (is this normal in the US?), and the steep, narrow road leading to the parking area kept my heart racing. I’m not great at reversing, so I was very relieved we didn’t encounter any oncoming cars!
Once parked, it was just a short 10–15-minute walk to the field site, a stunning glacial boulder field left over from the Pleistocene era. The boulders were scattered over a gentle slope of 5–10 degrees, with a nice low density—ideal conditions for our study.
The drone setup went smoothly, much to the amazement of my parents, who thought I’d be piloting it manually. Nope! Thanks to the wonders of modern technology, the drone handled the flight paths autonomously. After the first mapping round, I explained our task:
With their help, we wrapped up the measurements in about two hours, and the drone went back to work for a second mapping session. We hung around for a few more hours to complete a final flight, capturing data under different illumination conditions to study its effects on boulder detection.
Then came the long drive back to the Bay Area—six hours, but totally worth it. Combining a trip to Yosemite with fieldwork in the Sierra National Forest was such a unique experience. Huge thanks to my parents for being the best assistants I could ask for and always having my back. You two are the best!
Now it’s back to the lab, where I have a mountain of data to process and even more boulders to map. Not quite as exciting as being out in the field, but it’s all part of the process.
Until next time—see ya! 😊
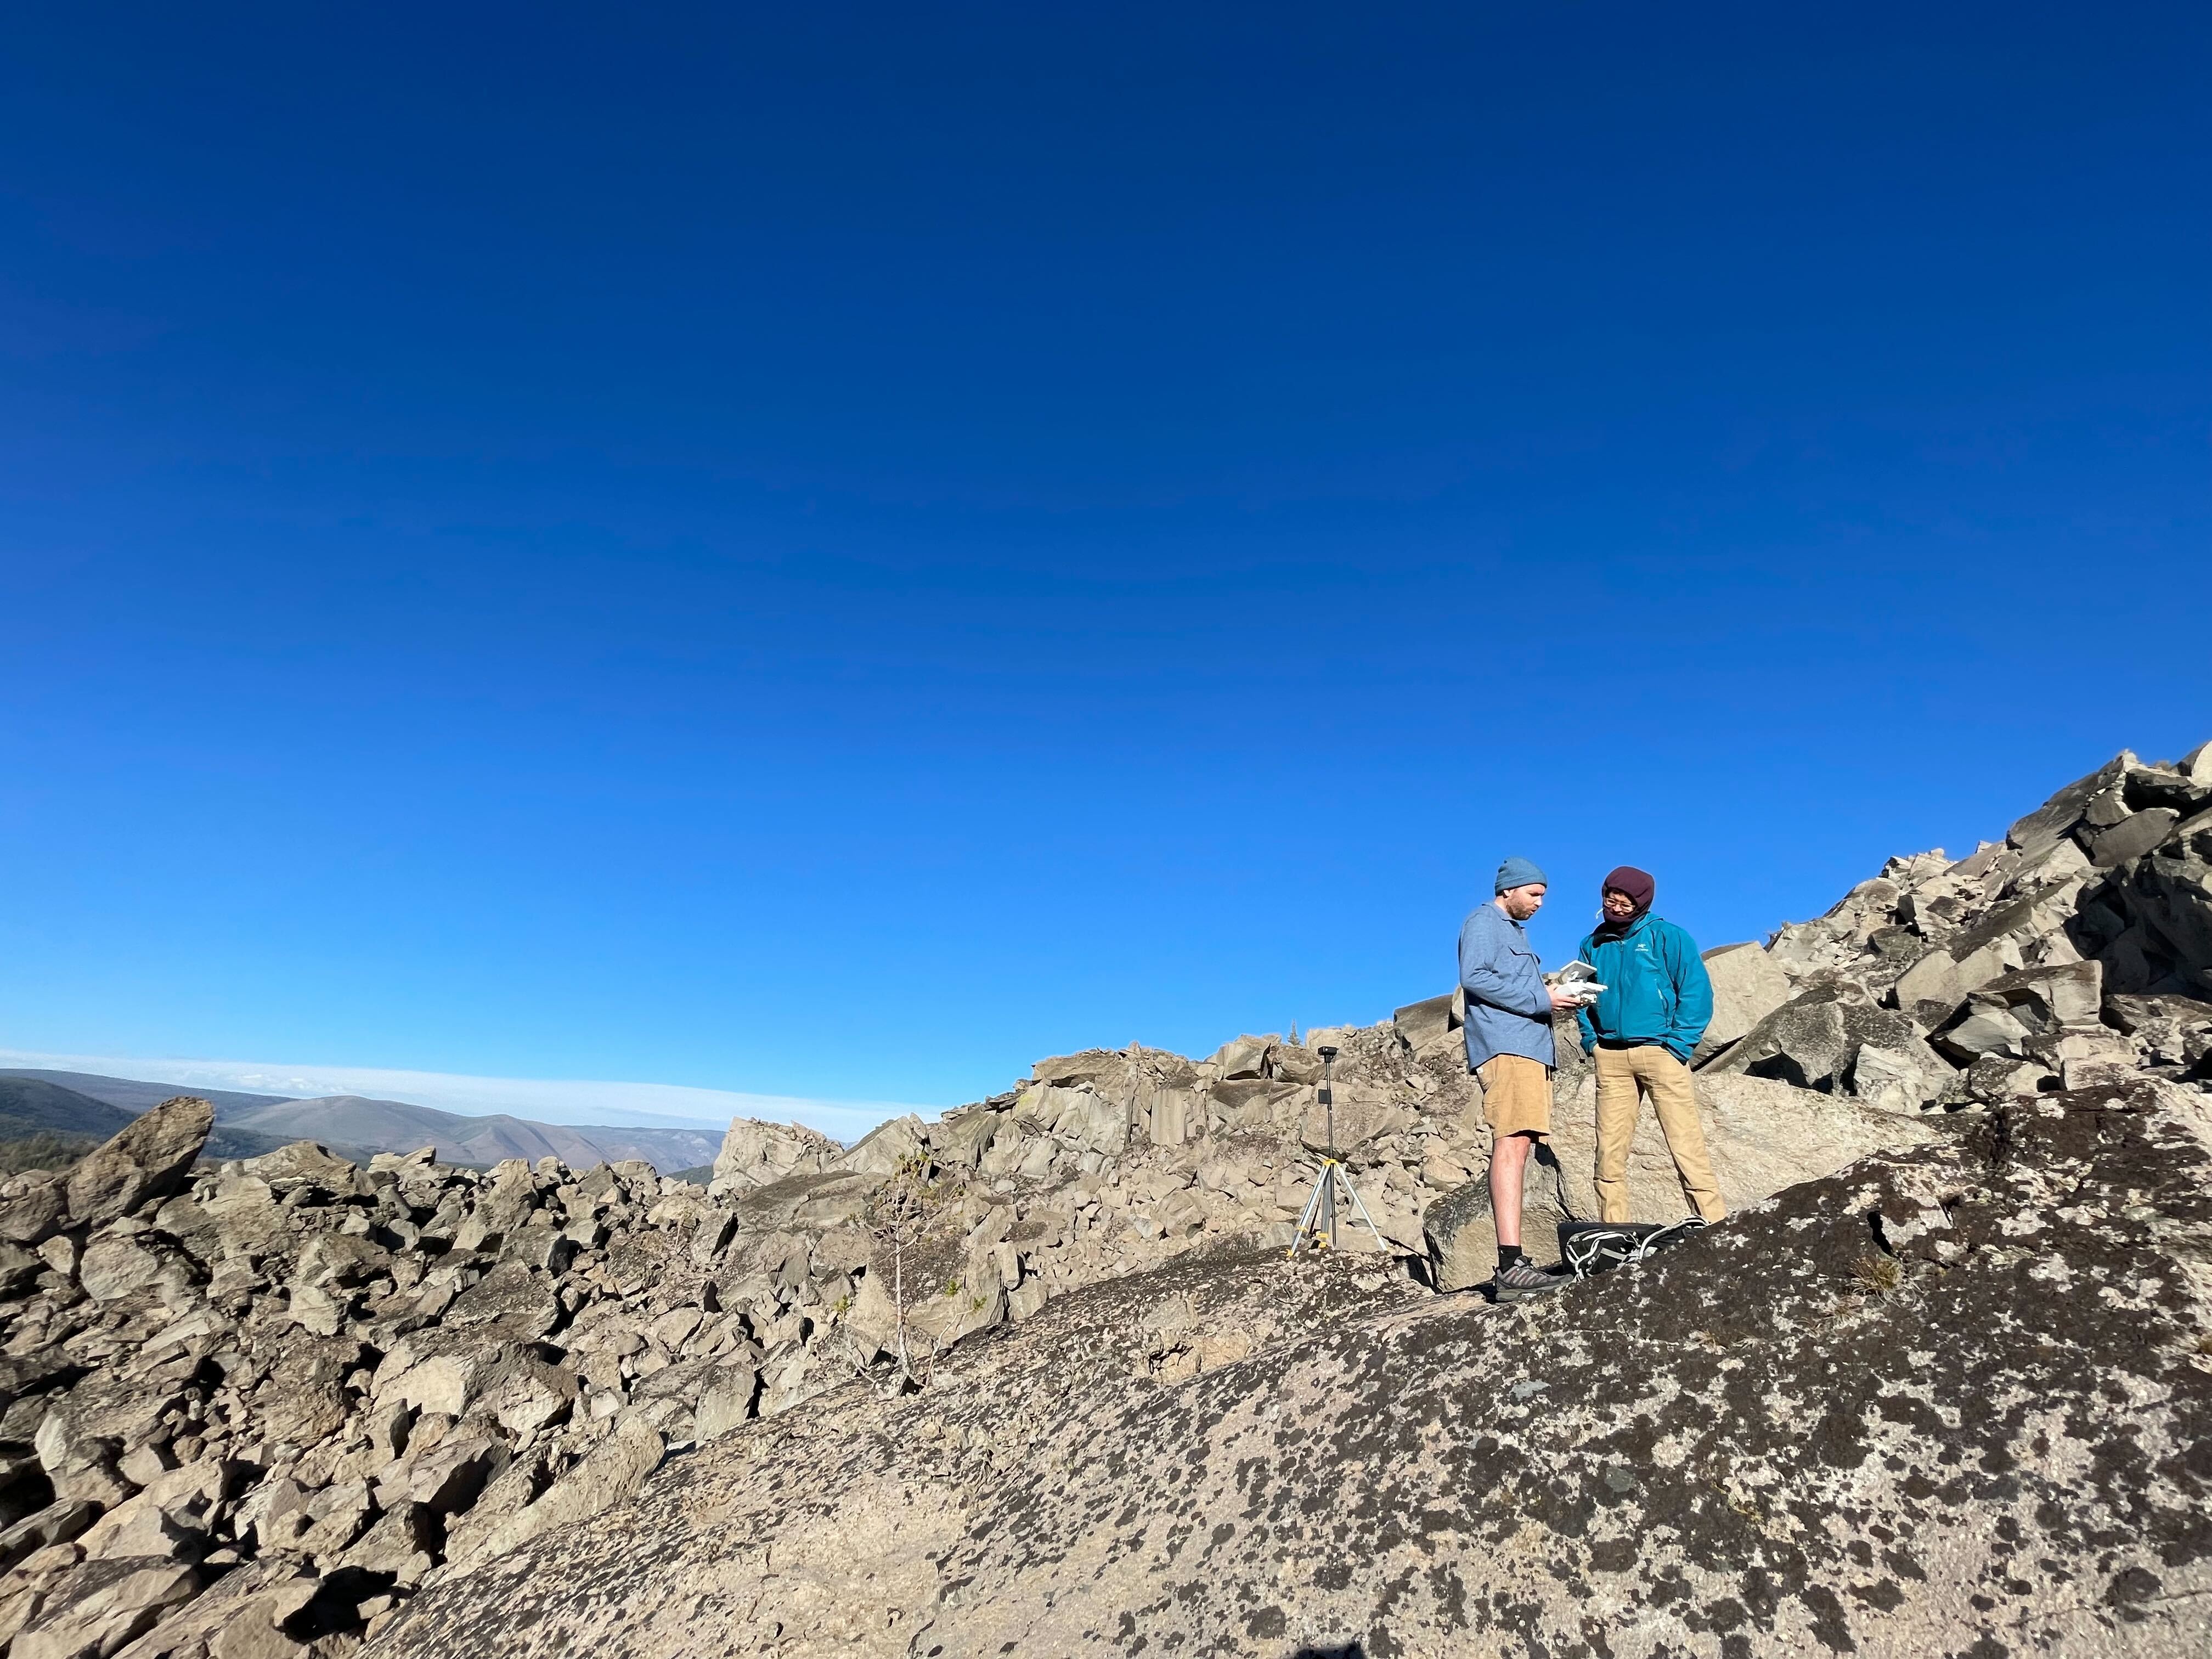
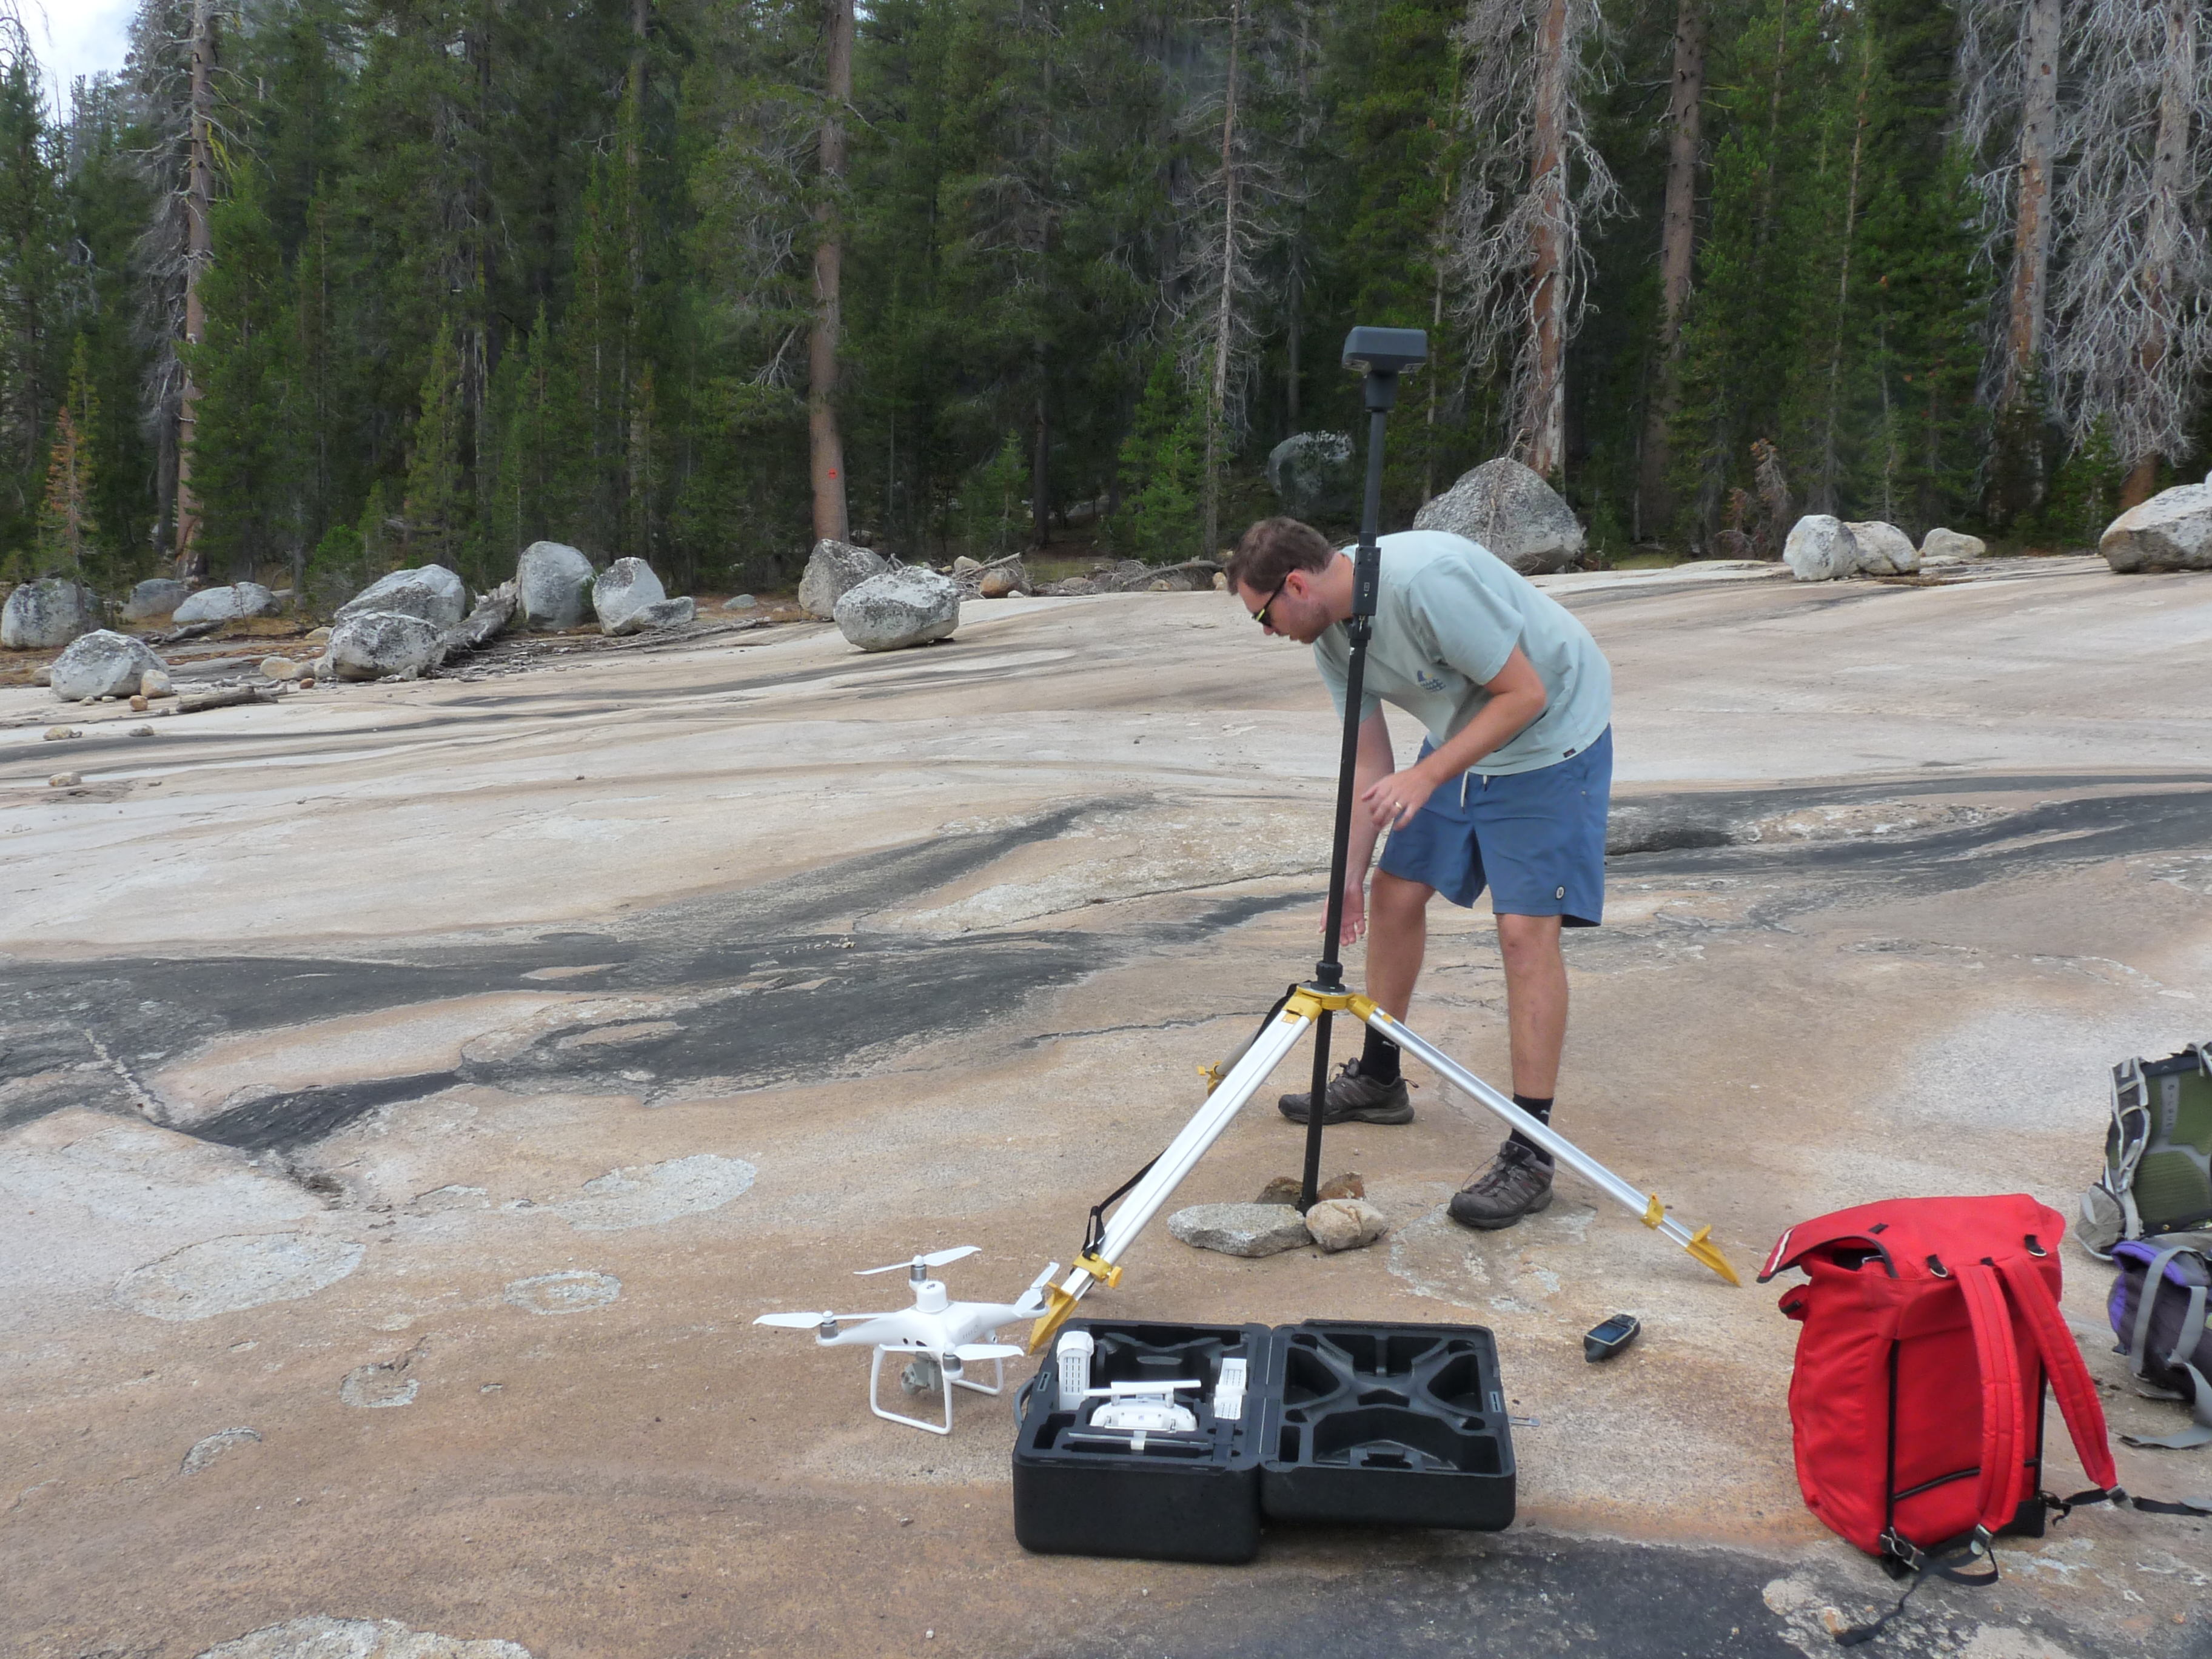 Caption: Setting up the GPS station and the drone.
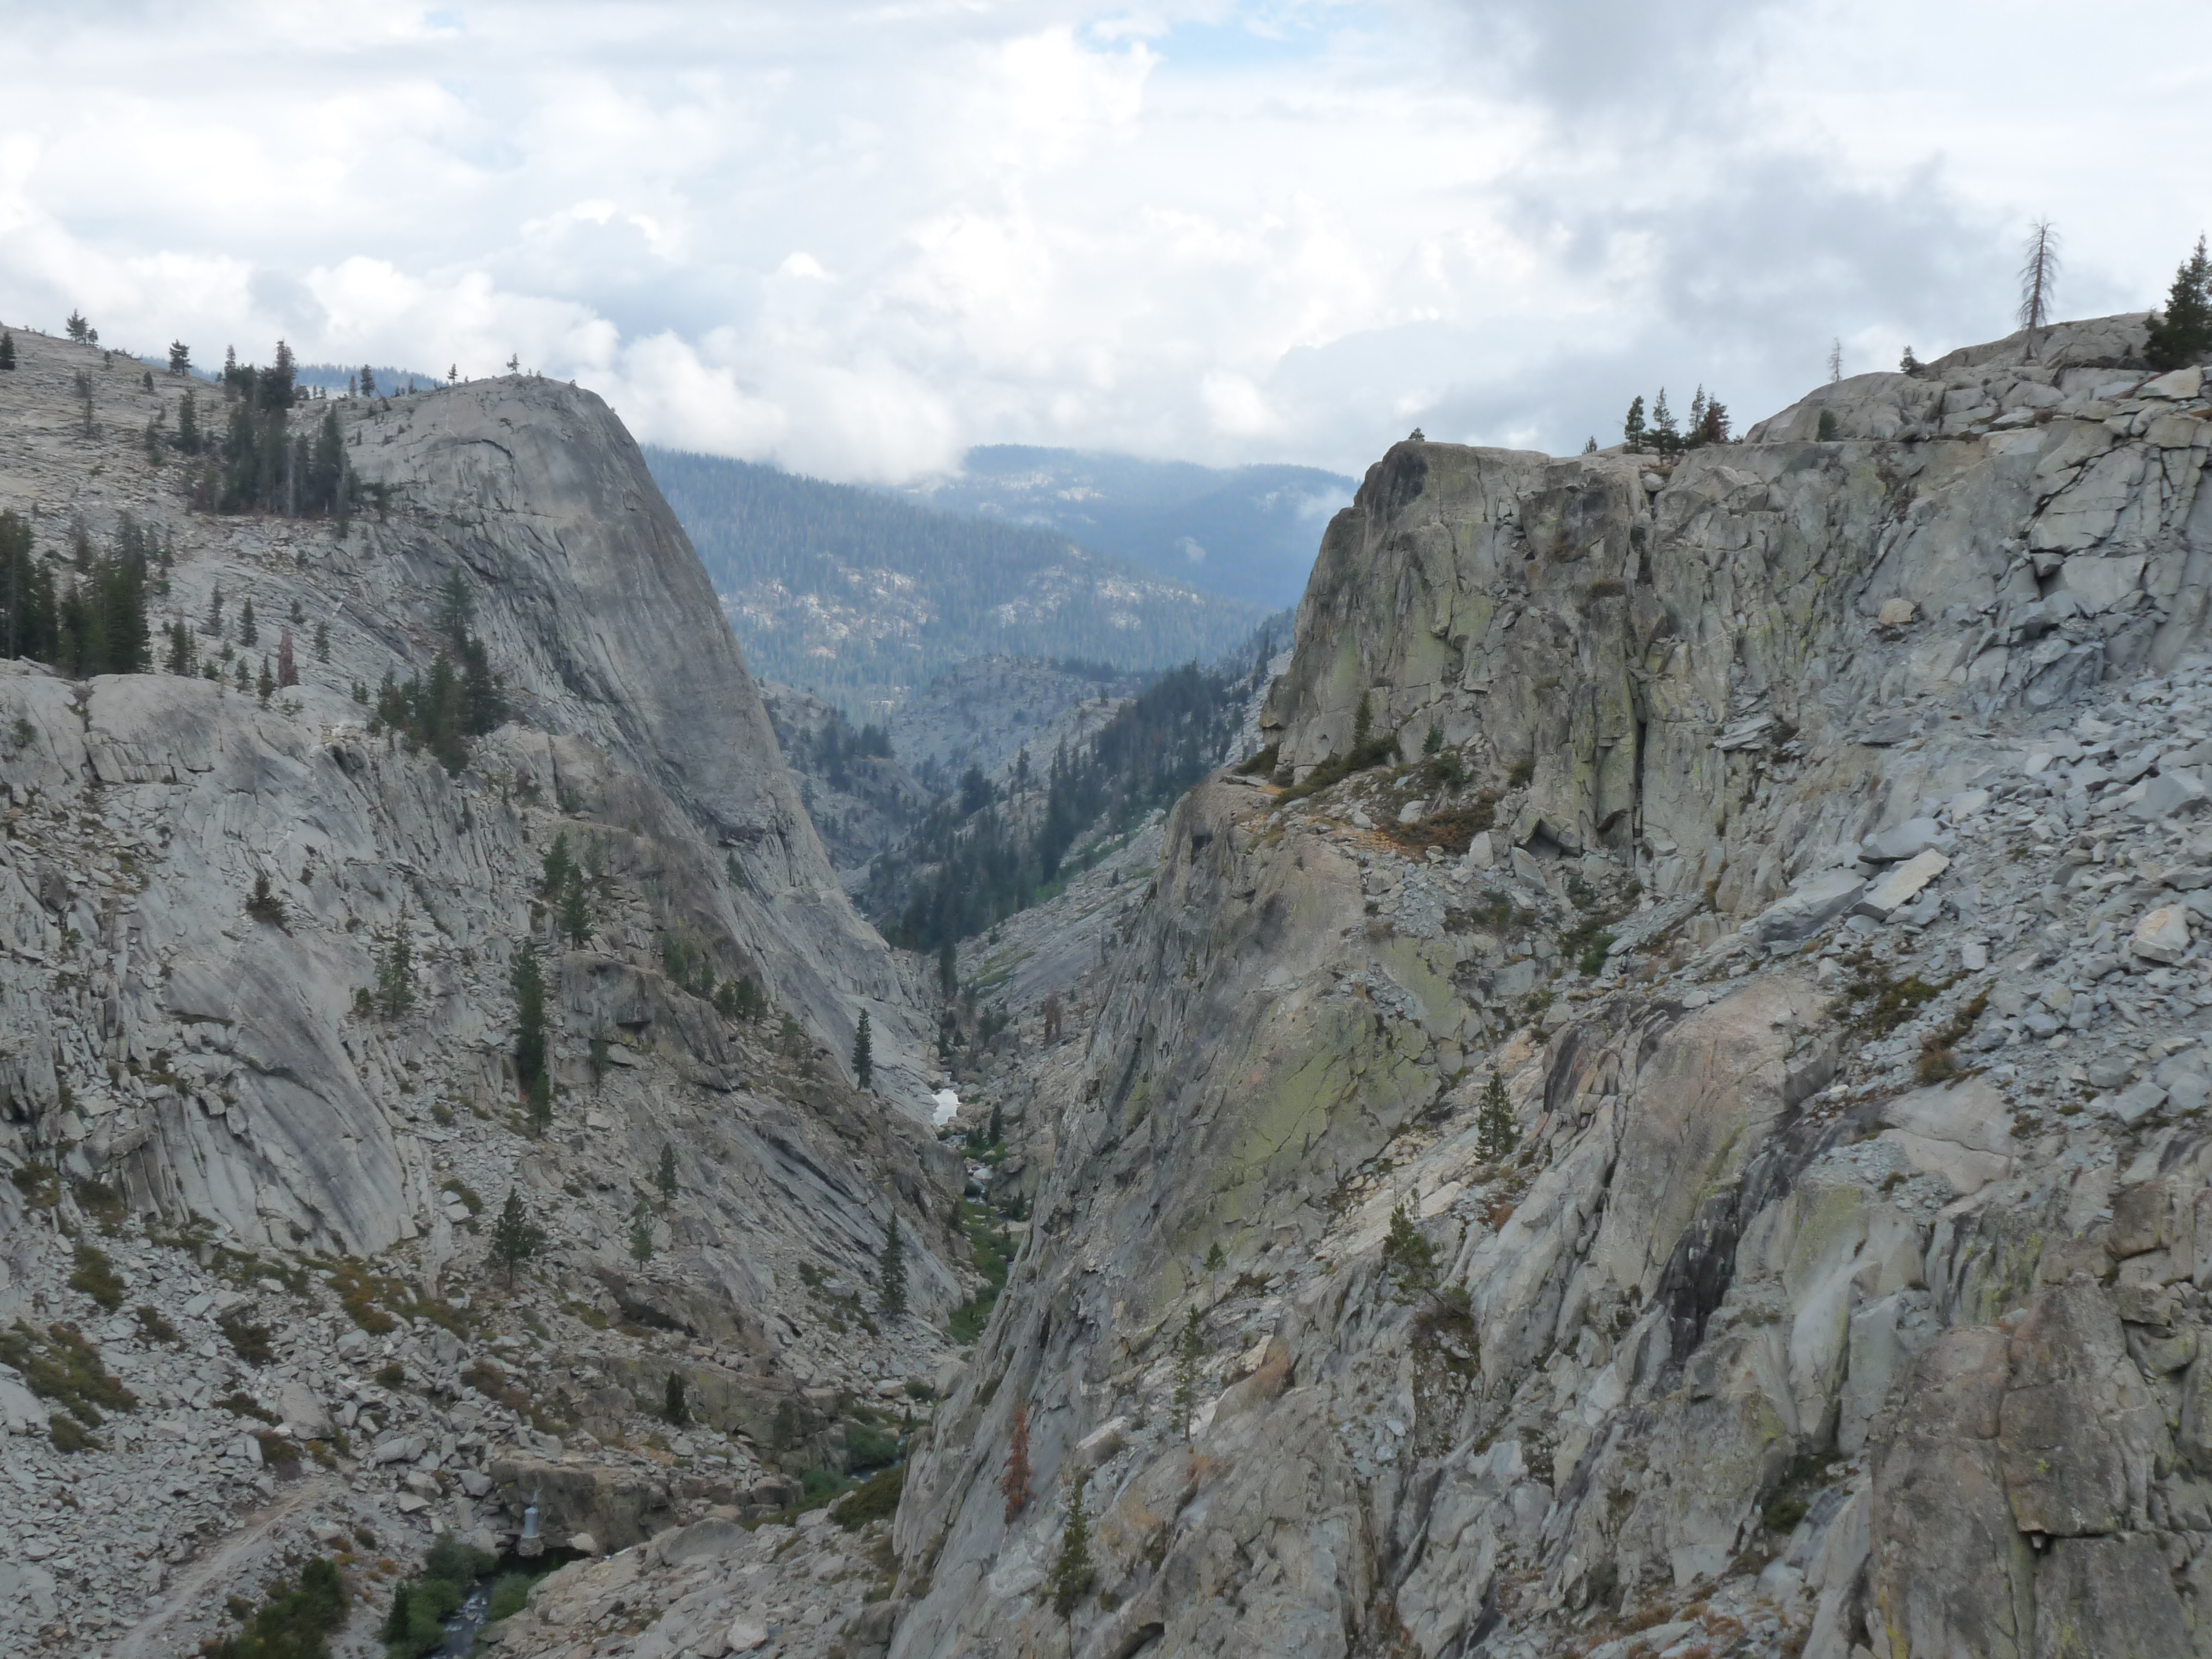
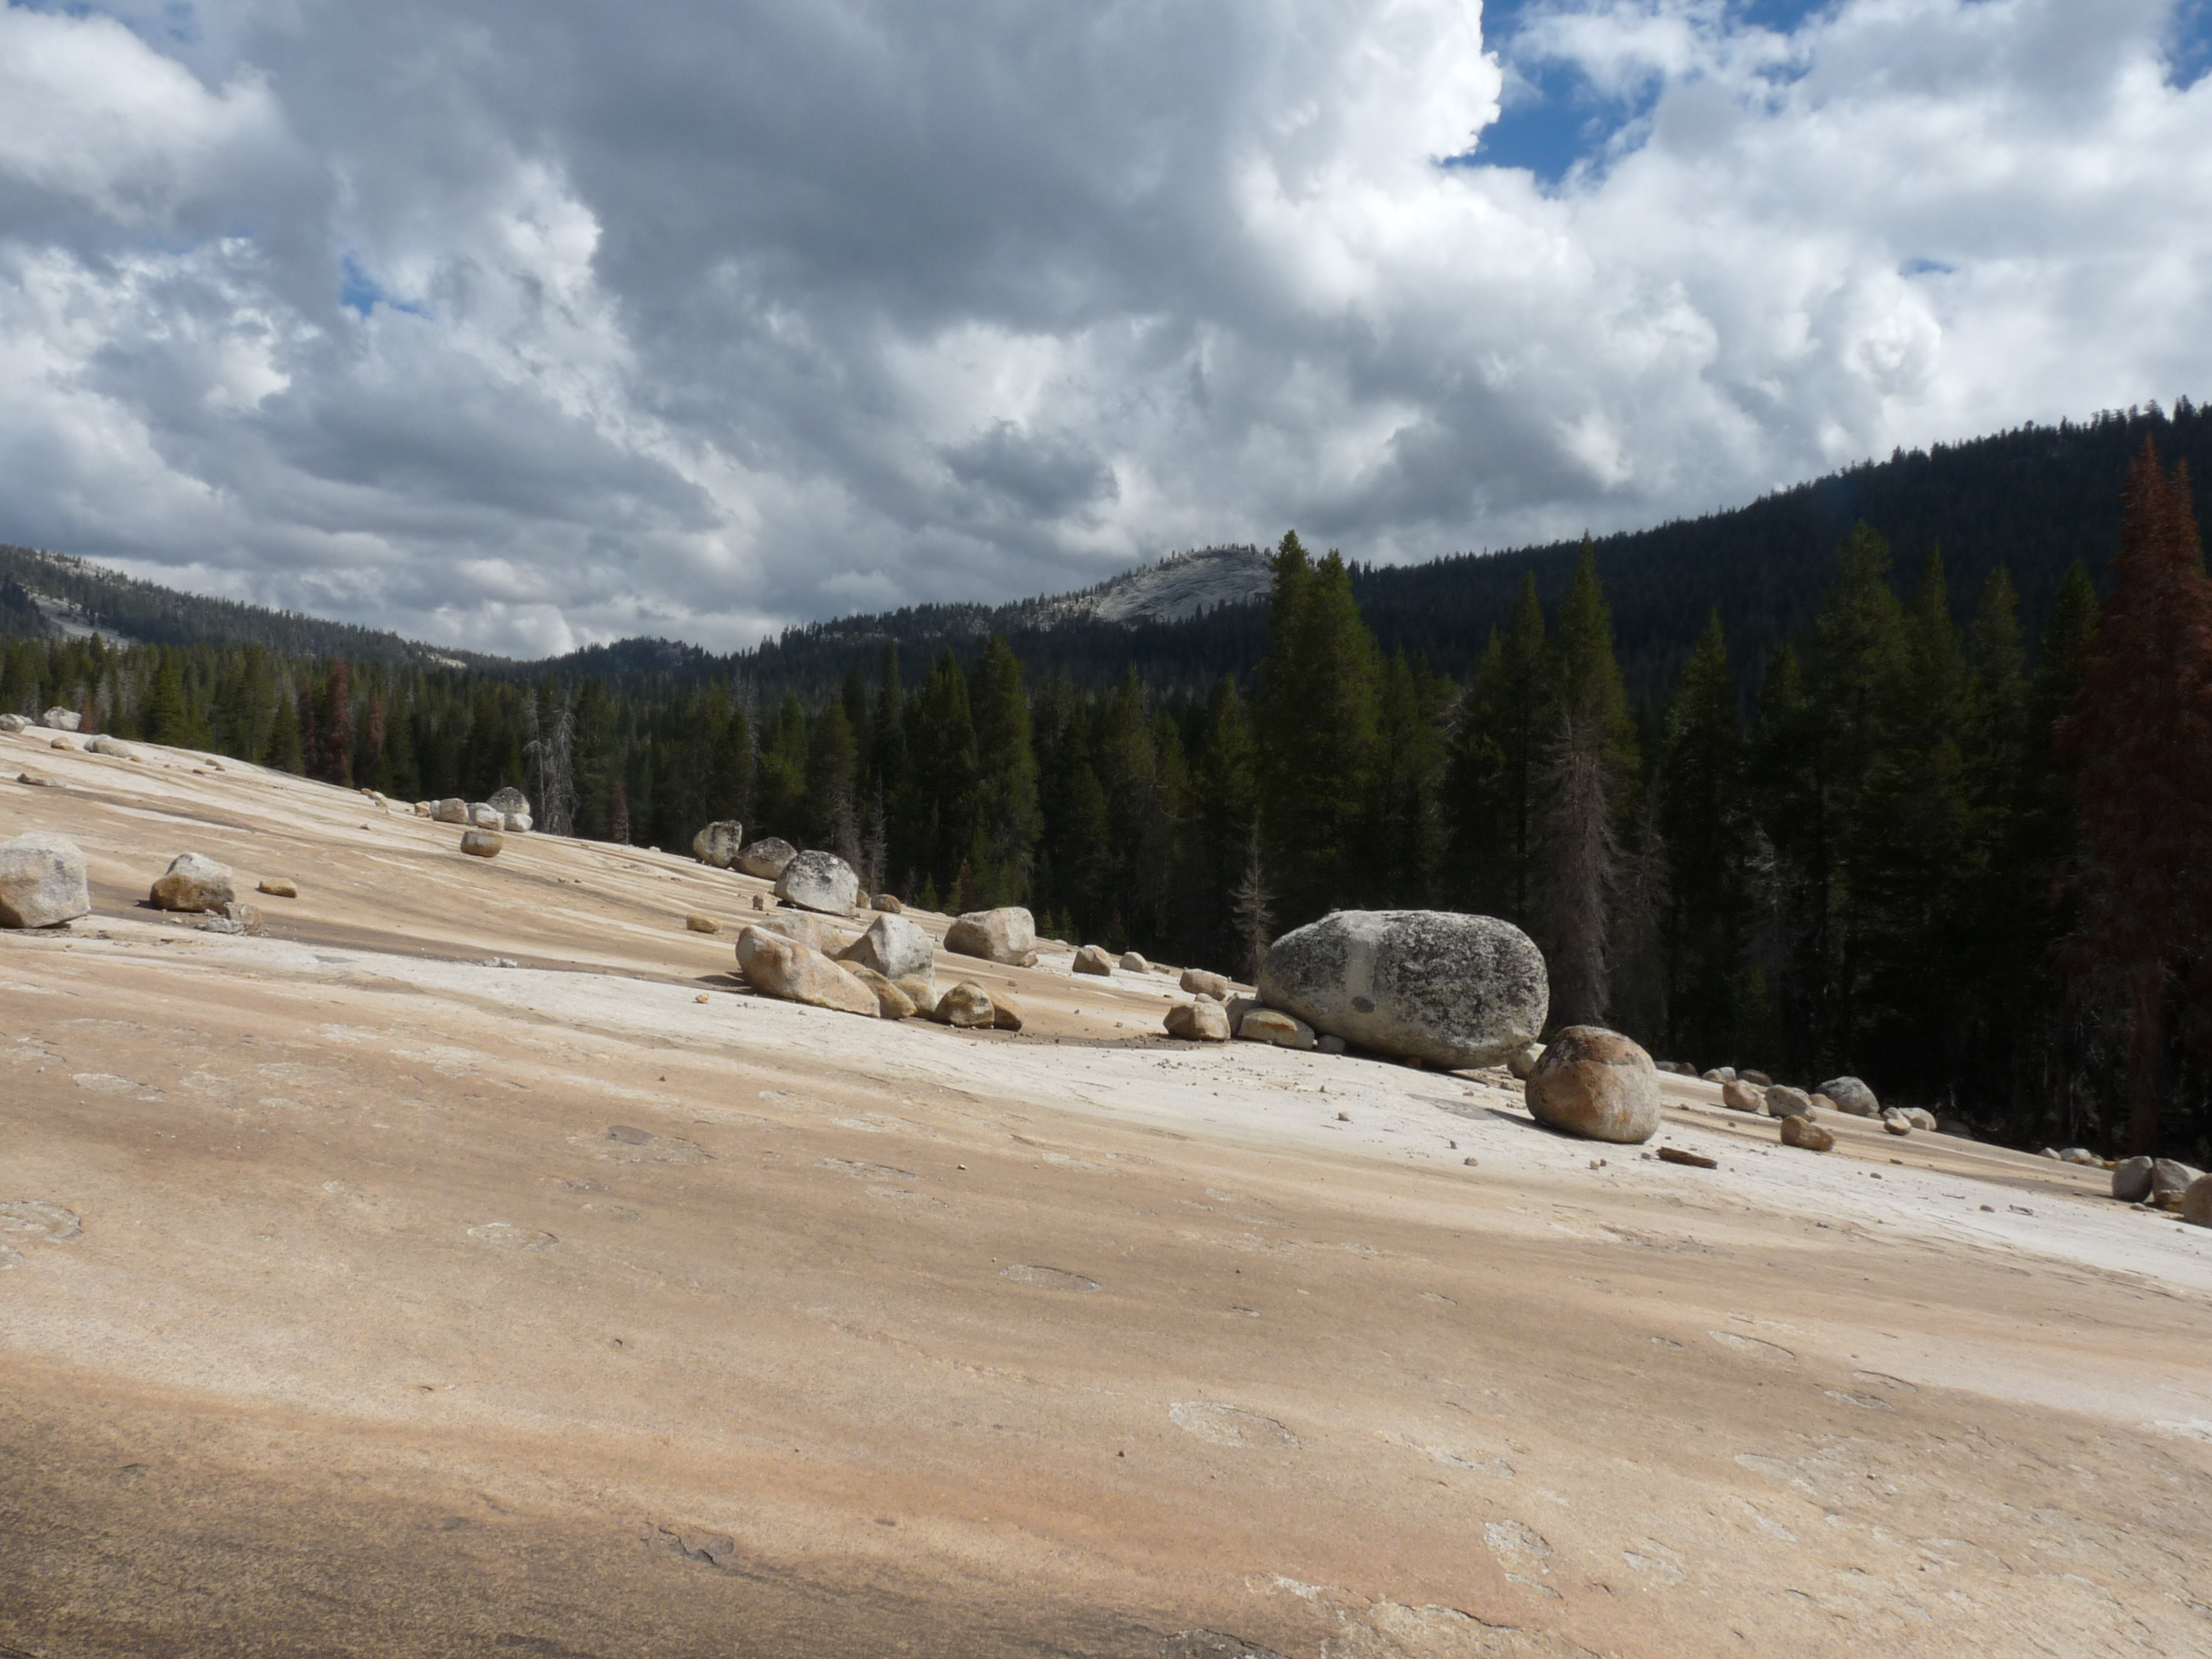 Caption: The boulder density at Courtright Reservoir is much lower. View of the glacial erratics from the side.
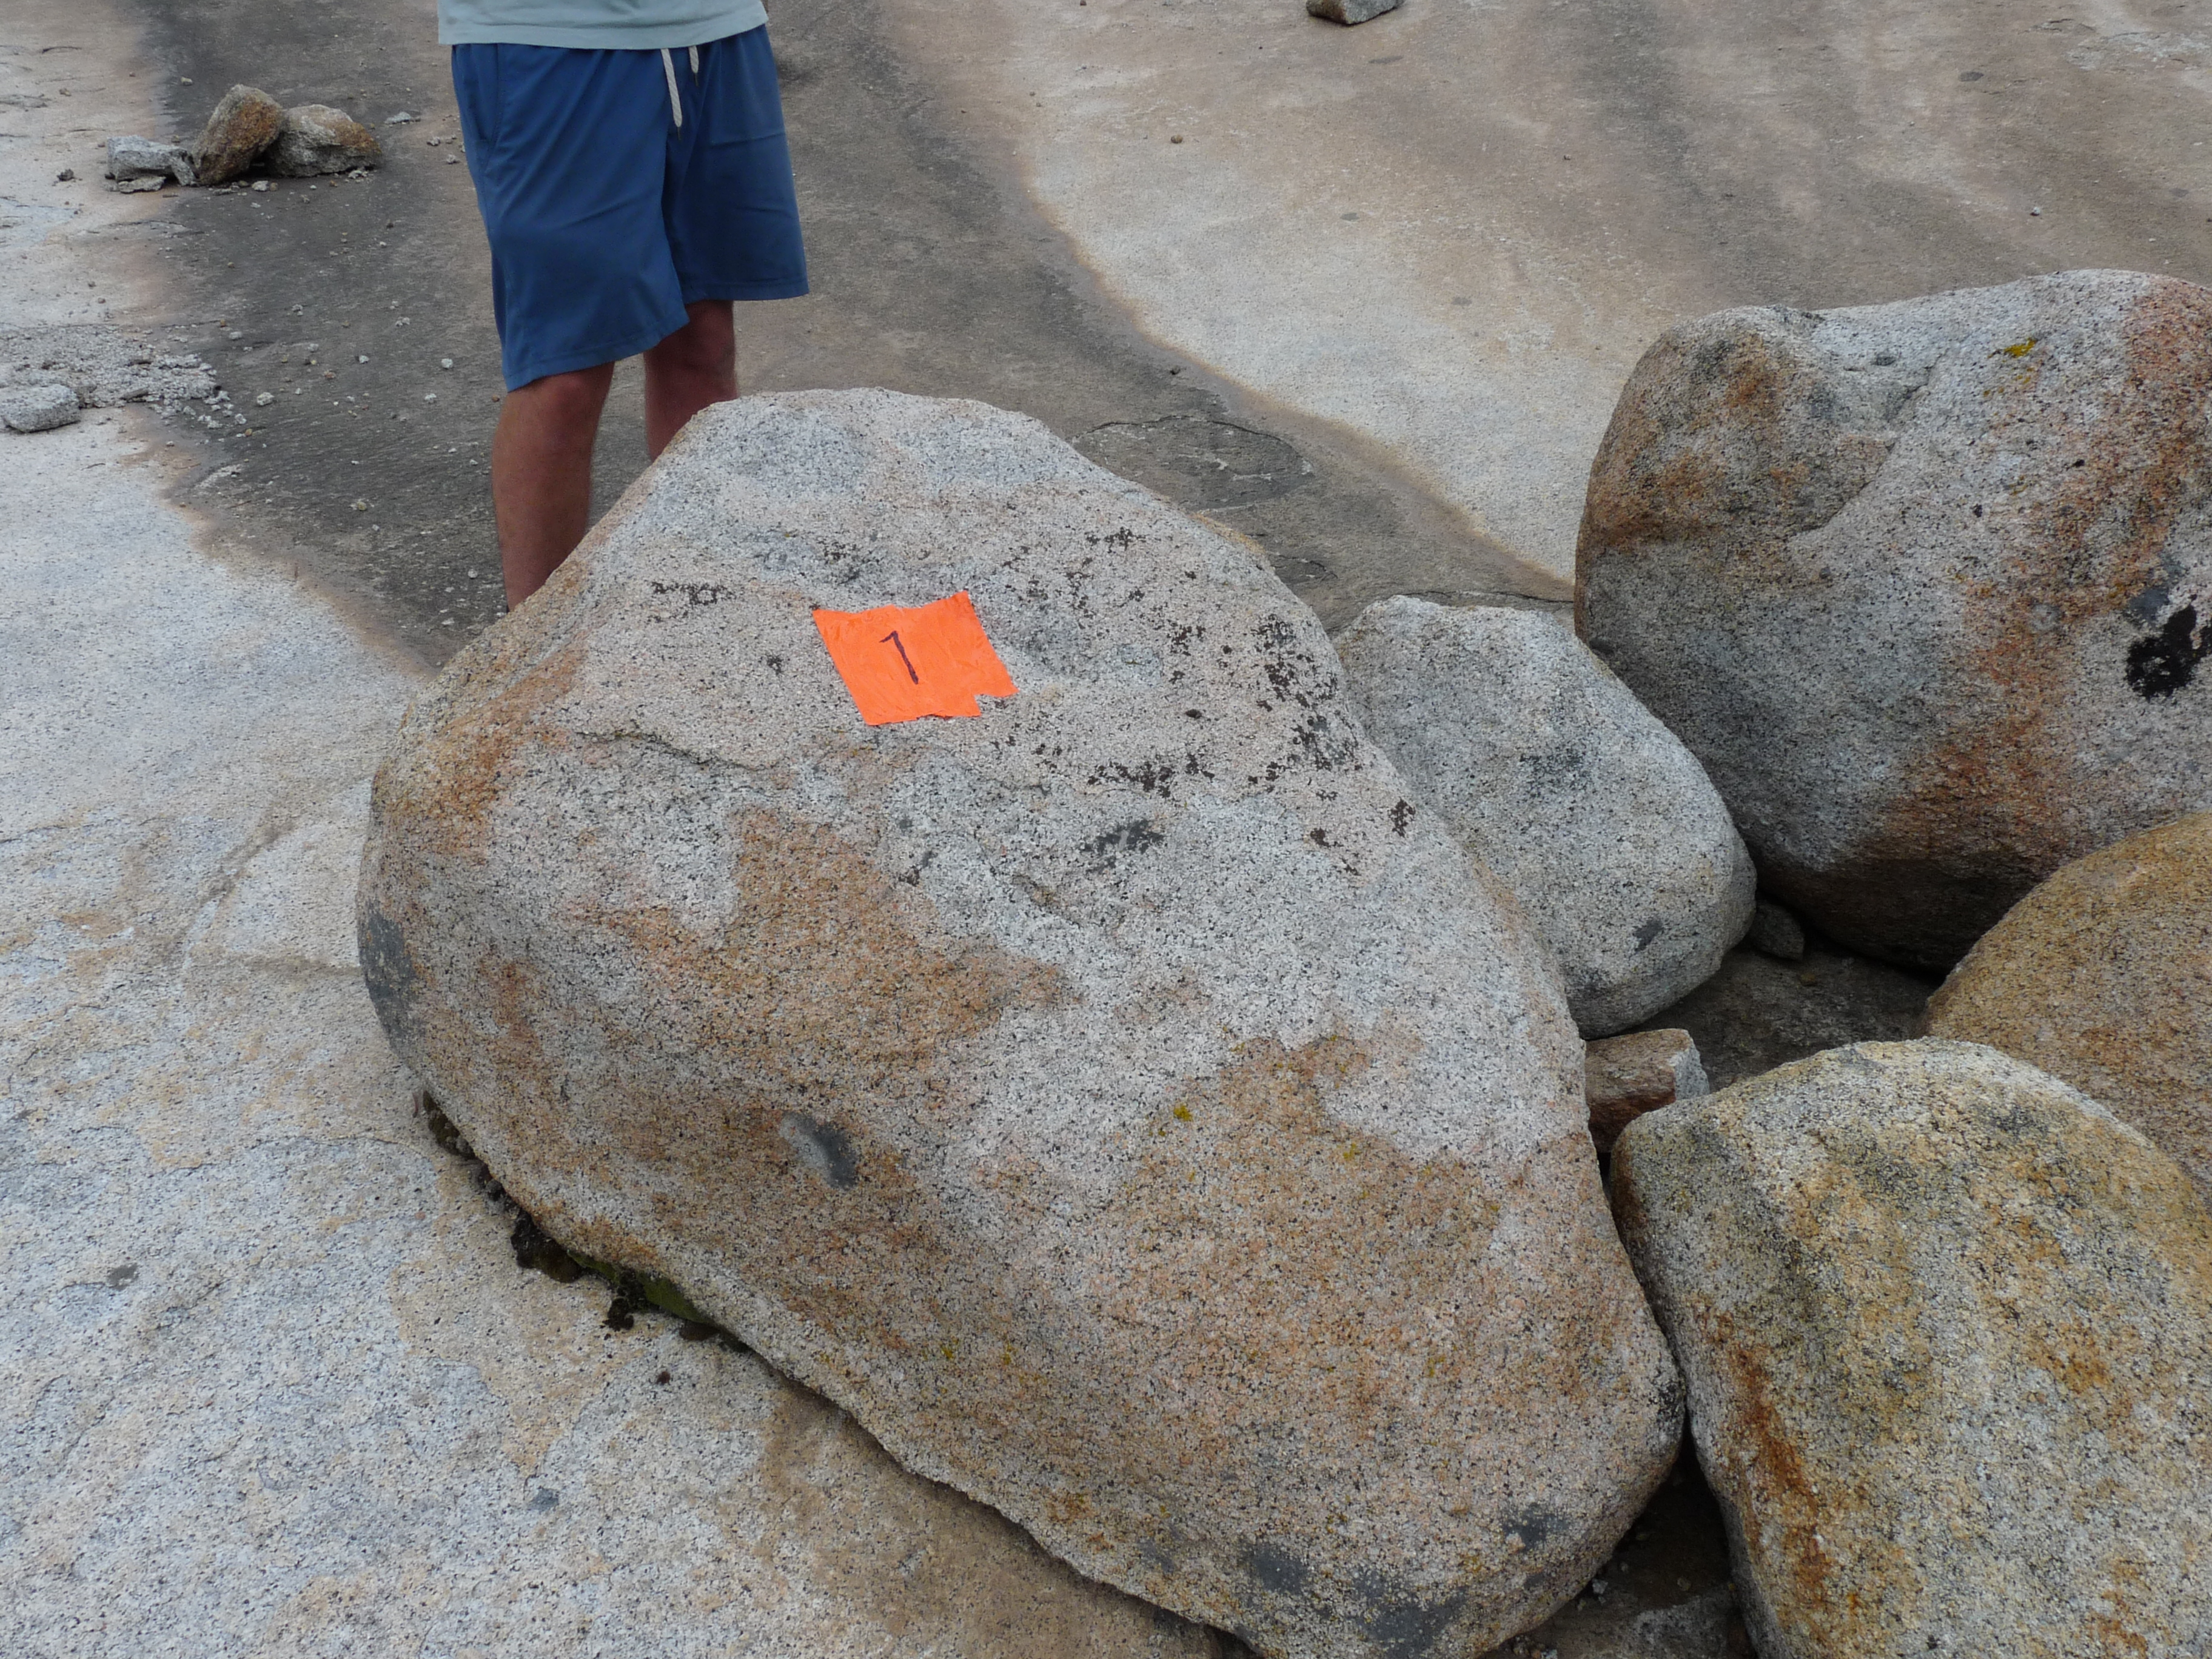 Caption: About 20 boulders were manually measured. They will be used to compare the morphometrics derived from the boulder detection algorithm.
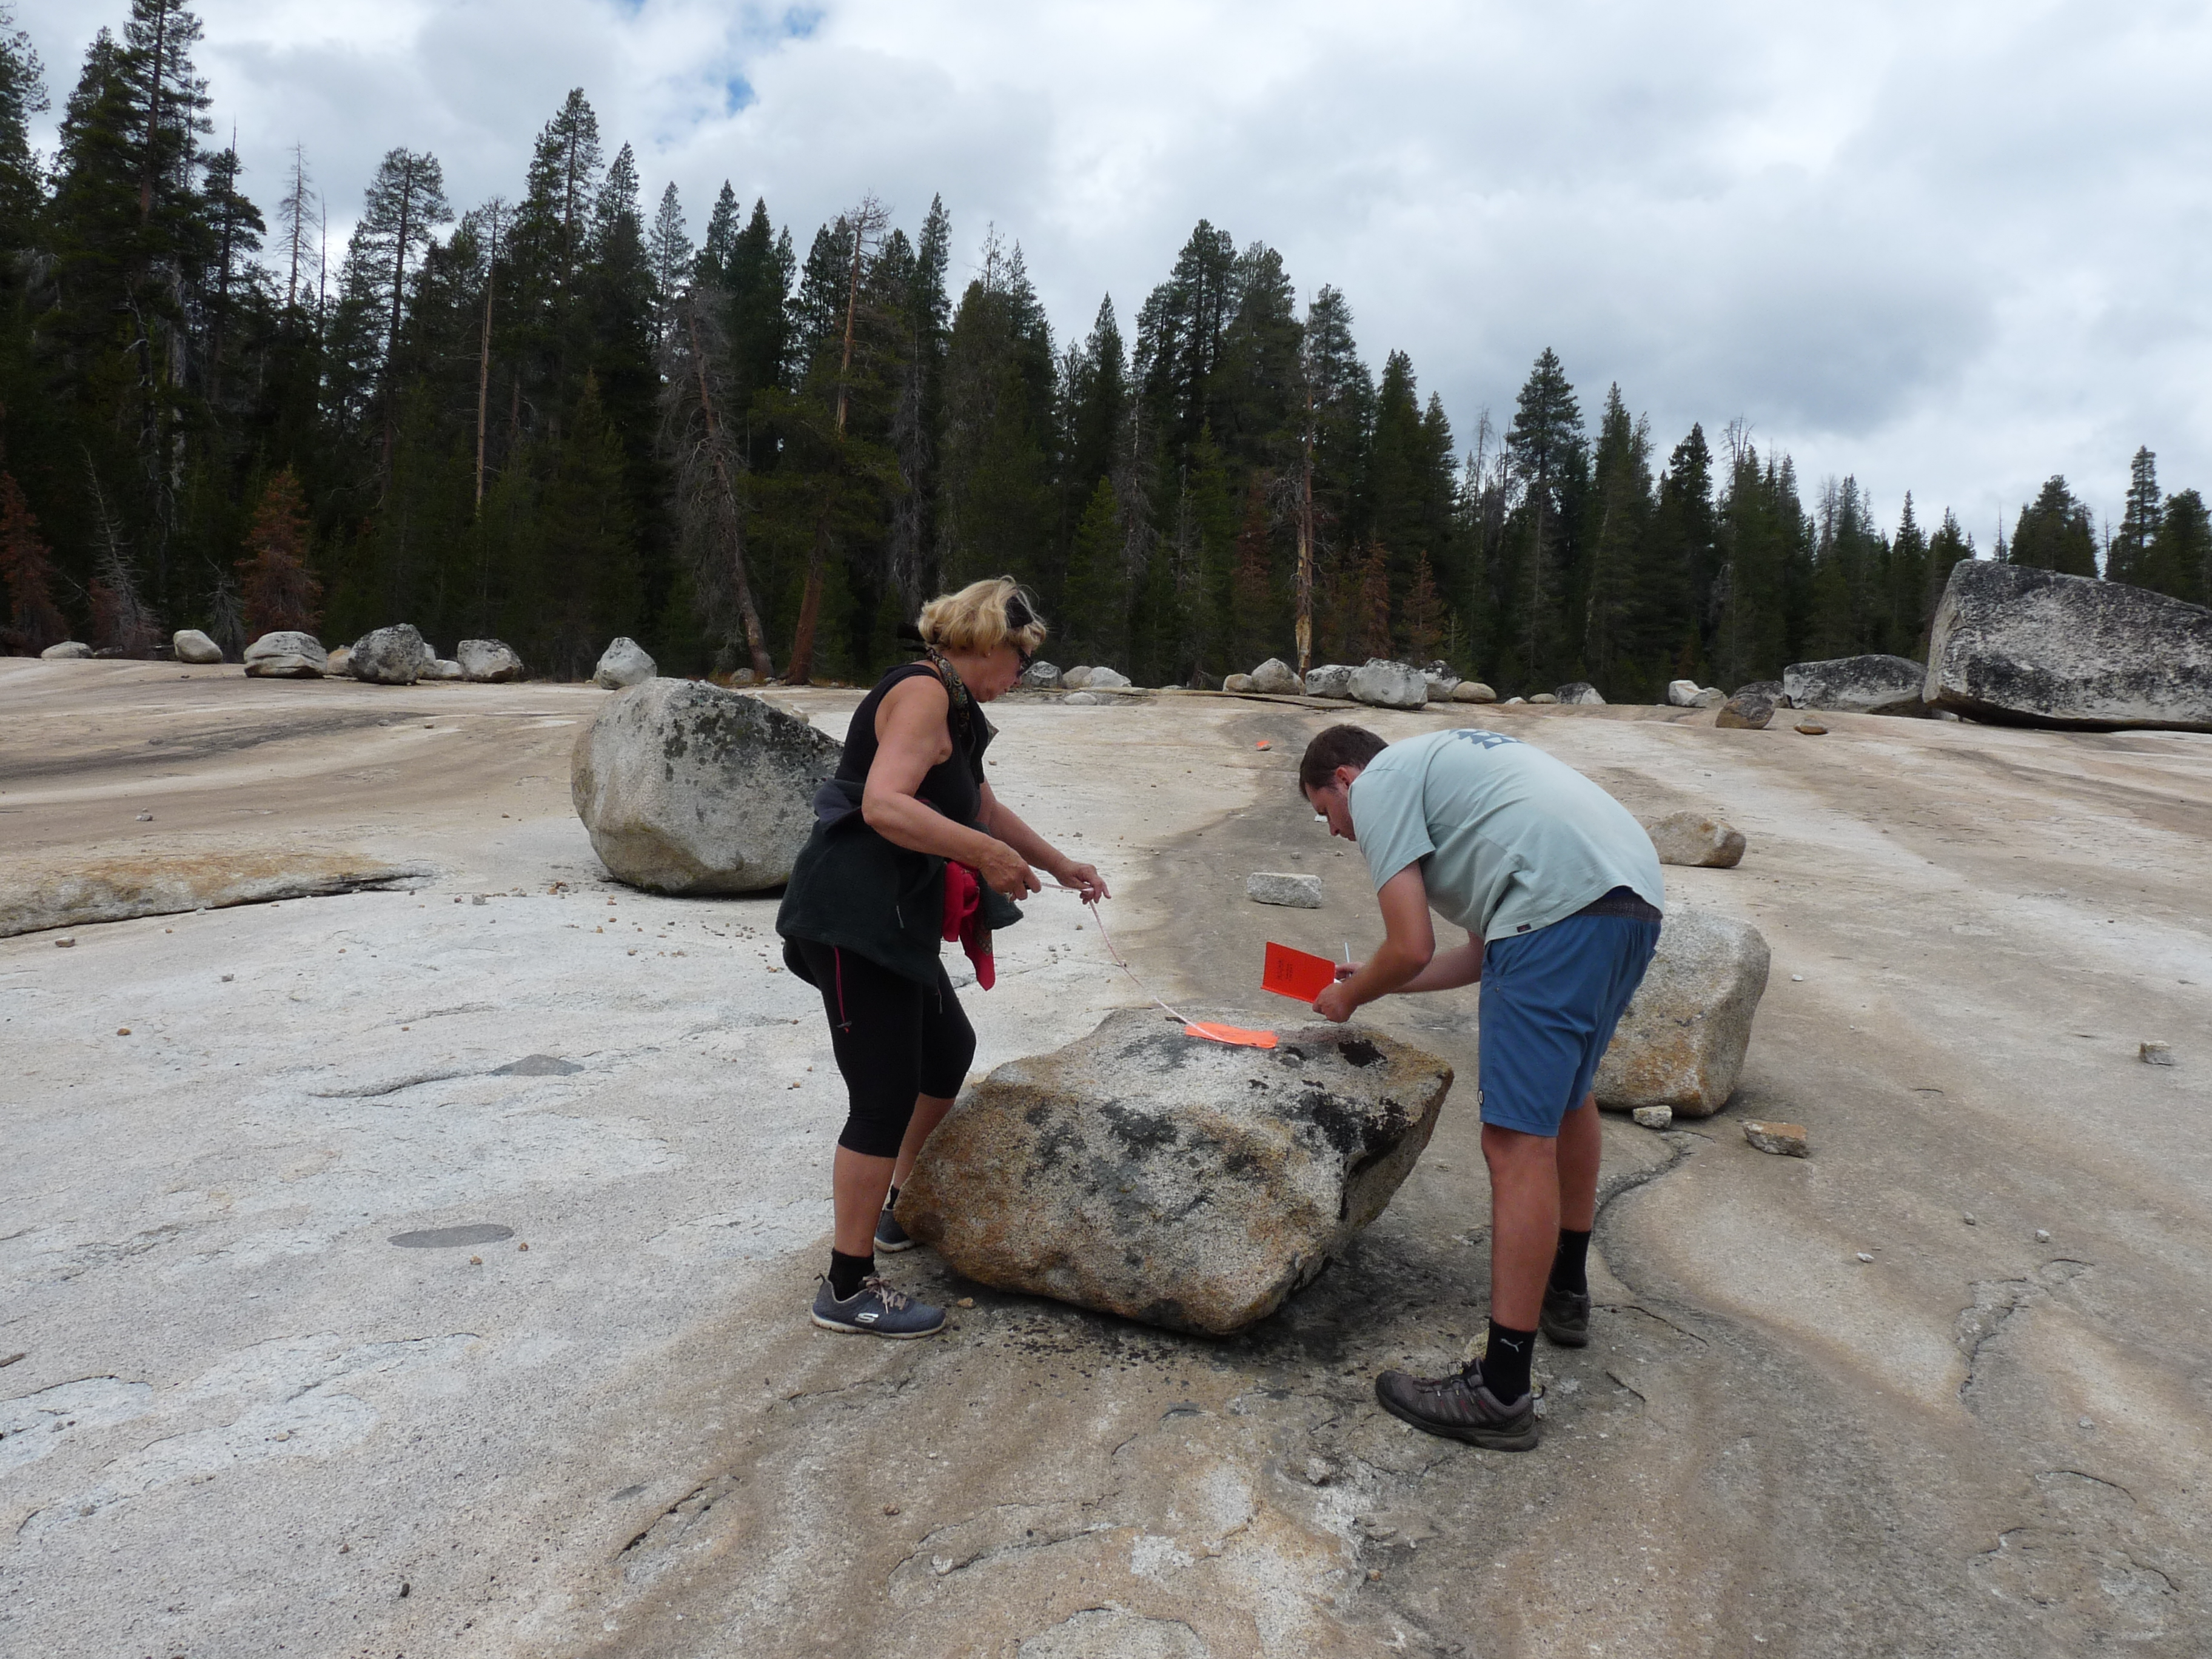 Caption: Putting my parents to work. We are measuring the short and long axes.
 Caption: Nice view on top of the dam on the way back from the fieldwork.
Published:
Hey everyone! This summer, starting in late June, I had the privilege of working with two brilliant undergraduate students who helped map boulder outlines for the BOULDERING project. It was a fantastic experience mentoring them and tackling this enormous task together. Here’s how it went:
First, let me introduce the team. Emiliano Gonzalez, an undergraduate at the University of Pomona, joined through Stanford’s SURGE program. This program supports undergrads new to research who are interested in pursuing master’s or Ph.D. studies in Earth sciences, environmental sciences, energy sciences, or engineering. SURGE is an amazing initiative aimed at increasing diversity and inclusion in the geosciences (learn more about it here). Emiliano focused on understanding how target properties influence ejection processes on the Moon and how slow erosion from micrometeorite impacts affects boulder evolution over time.
The second student, Brian Amaro, is a Stanford undergraduate who received a summer research stipend. Brian’s work centered on boulder populations on Mars, particularly in areas of interest for Dr. Mathieu Lapotre. Instead of focusing on impact fragmentation, Brian explored boulders formed by other geological processes.
The first weeks of summer were all about mentoring. I introduced them to QGIS and the intricacies of mapping boulder outlines. You’d think identifying a boulder would be straightforward, but when you’re working with satellite images with a resolution limit of ~30 cm, it’s anything but. Smaller boulders often appear partially buried or oddly shaped, and illumination conditions in the images can make them tricky to identify. Together, we spent many afternoons developing a clear, consistent definition of what qualifies as a boulder—and what doesn’t.
We also established workflows for quality control, like cross-checking each other’s mapped boulders. Once the foundation was set, we aimed to map 400 boulders a day (roughly 2–3 hours of mapping). While none of us hit that goal every single day, we collectively mapped over 30,000 boulders—a number I could never have achieved on my own.
To cap it off, I taught Brian and Emiliano how to post-process the data in Python, so they could present their work and preliminary results in early August. They both excelled, and I’m confident their findings will make a splash at upcoming conferences.
On a personal note, I absolutely loved mentoring them. It was incredibly fulfilling to watch their skills grow over the summer, and I hope they enjoyed the experience as much as I did. Here’s to a summer of learning, collaboration, and a ton of boulders mapped!
Cheerios until next time! 😊
 Caption: Brian & Emiliano, the two summer interns that will help with the BOULDERING project!
 Caption: Siri is baaaack in the US! So nice :)
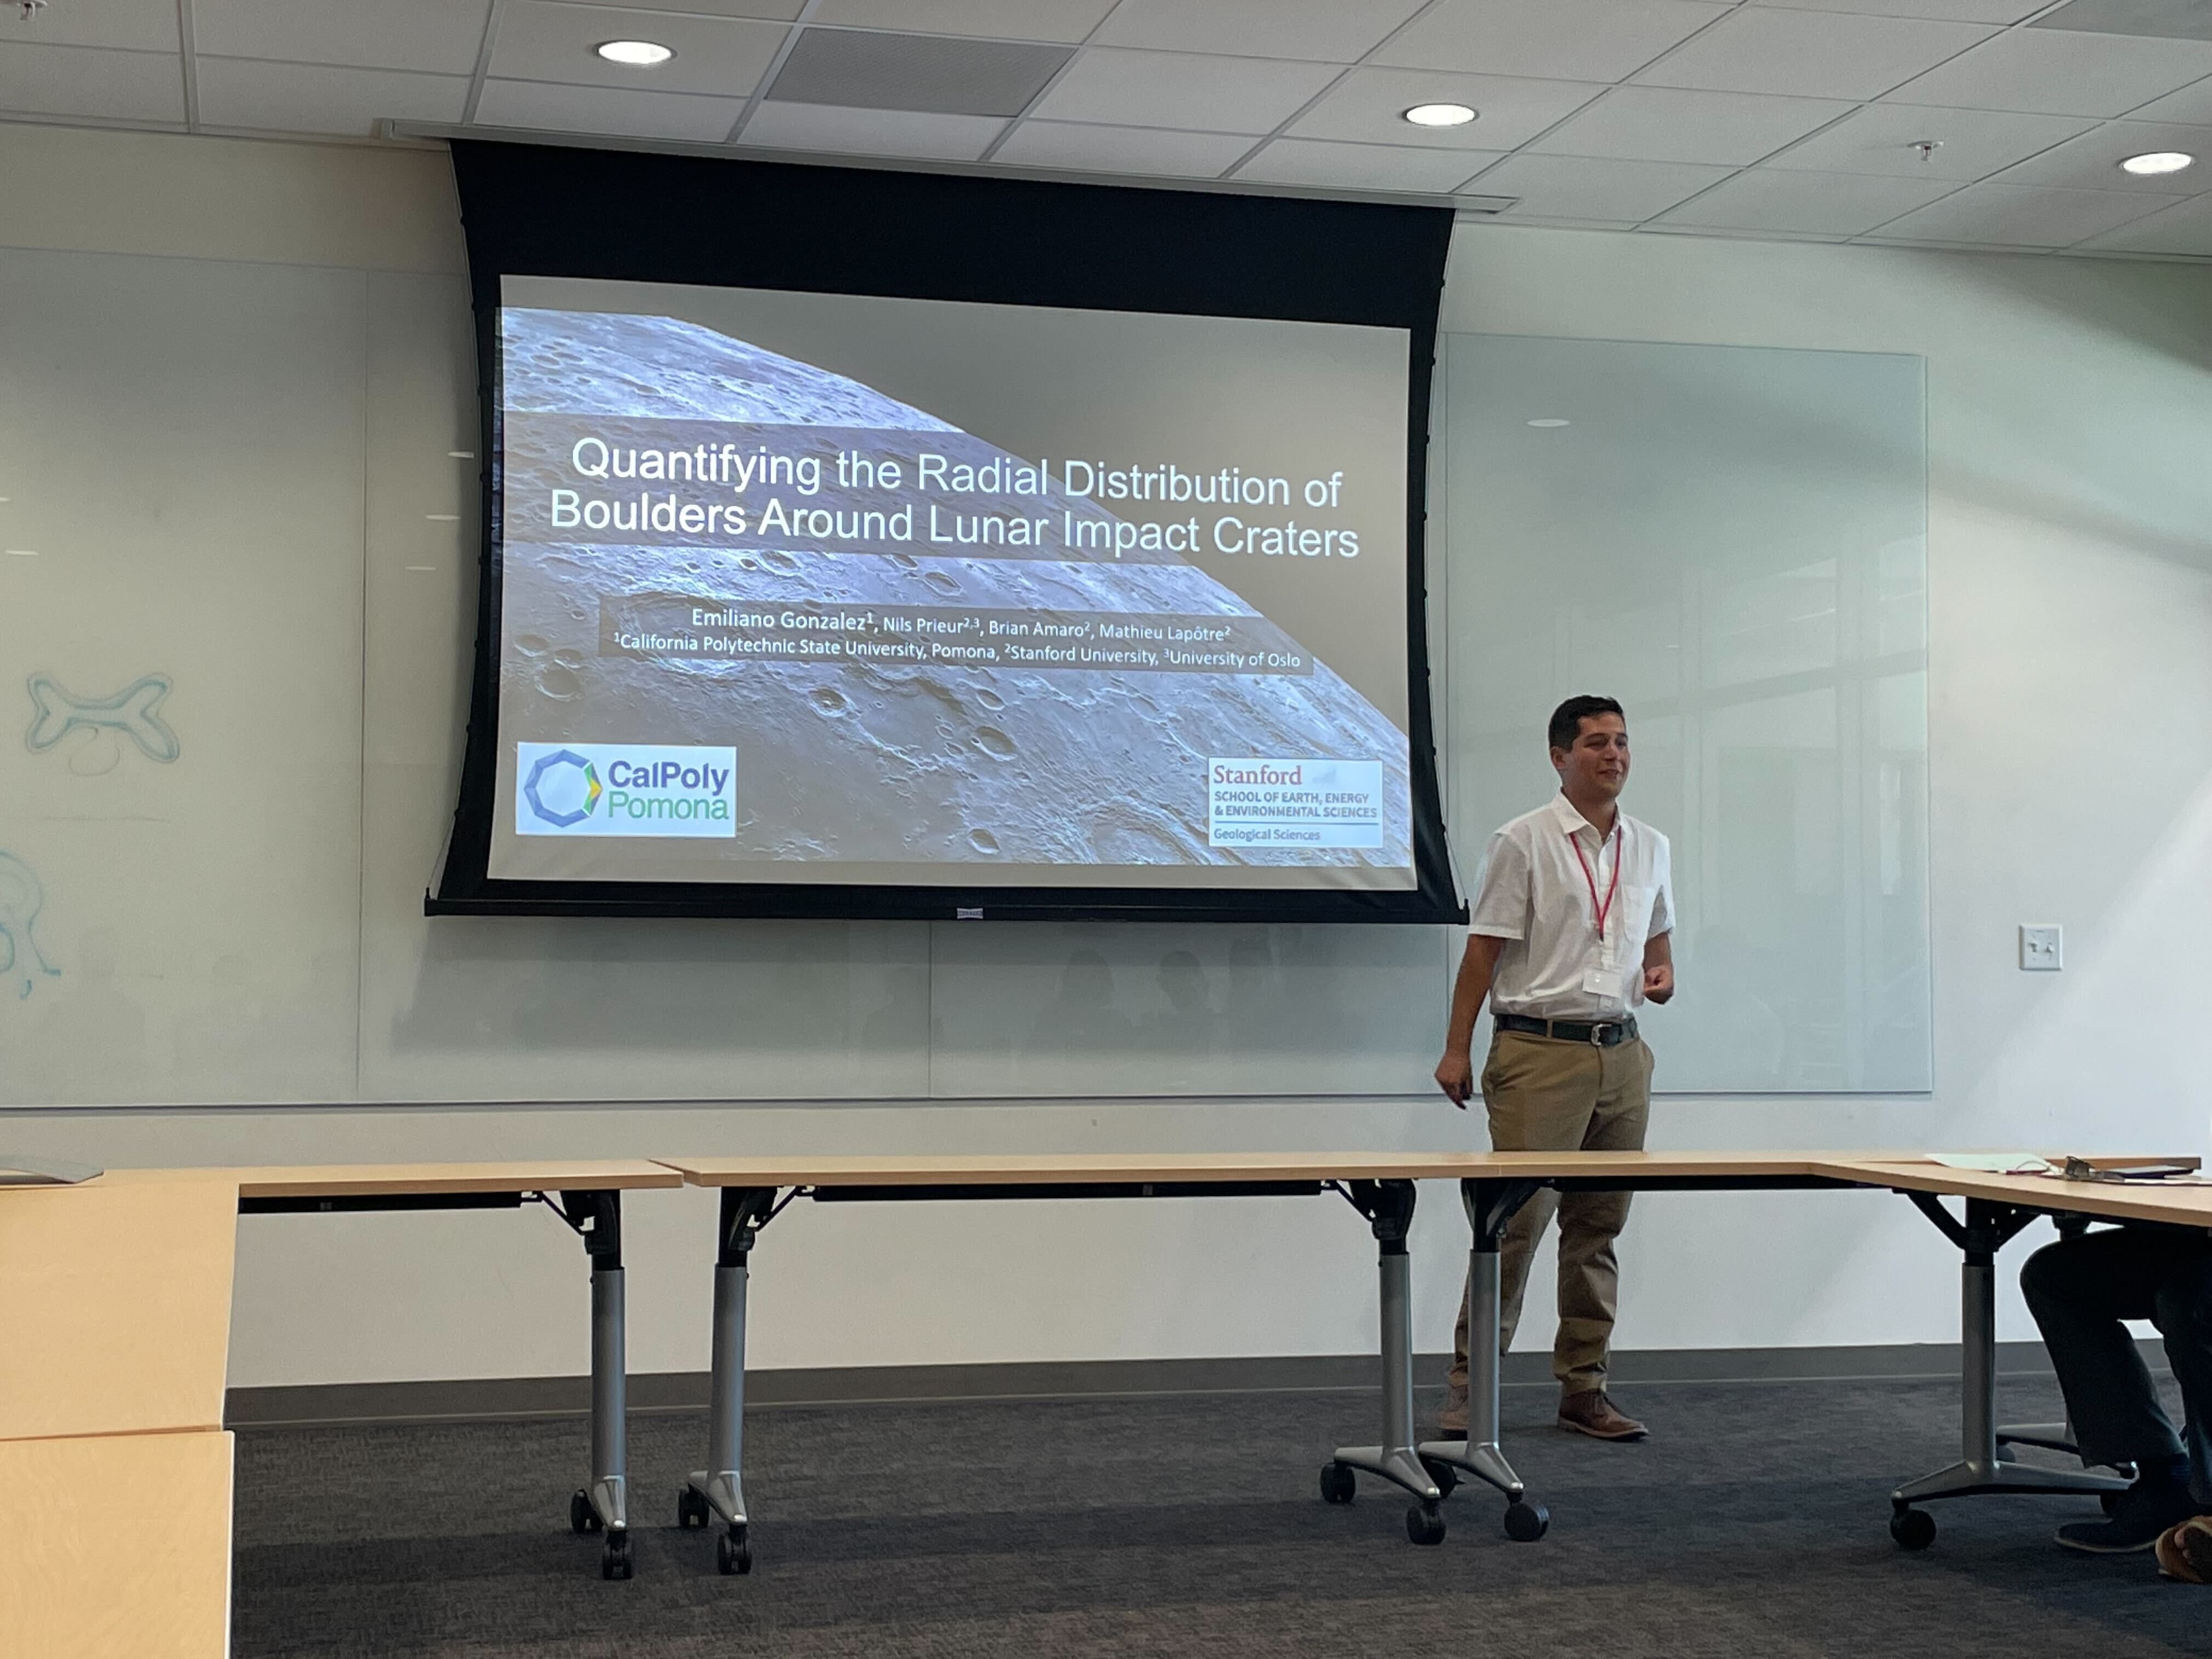
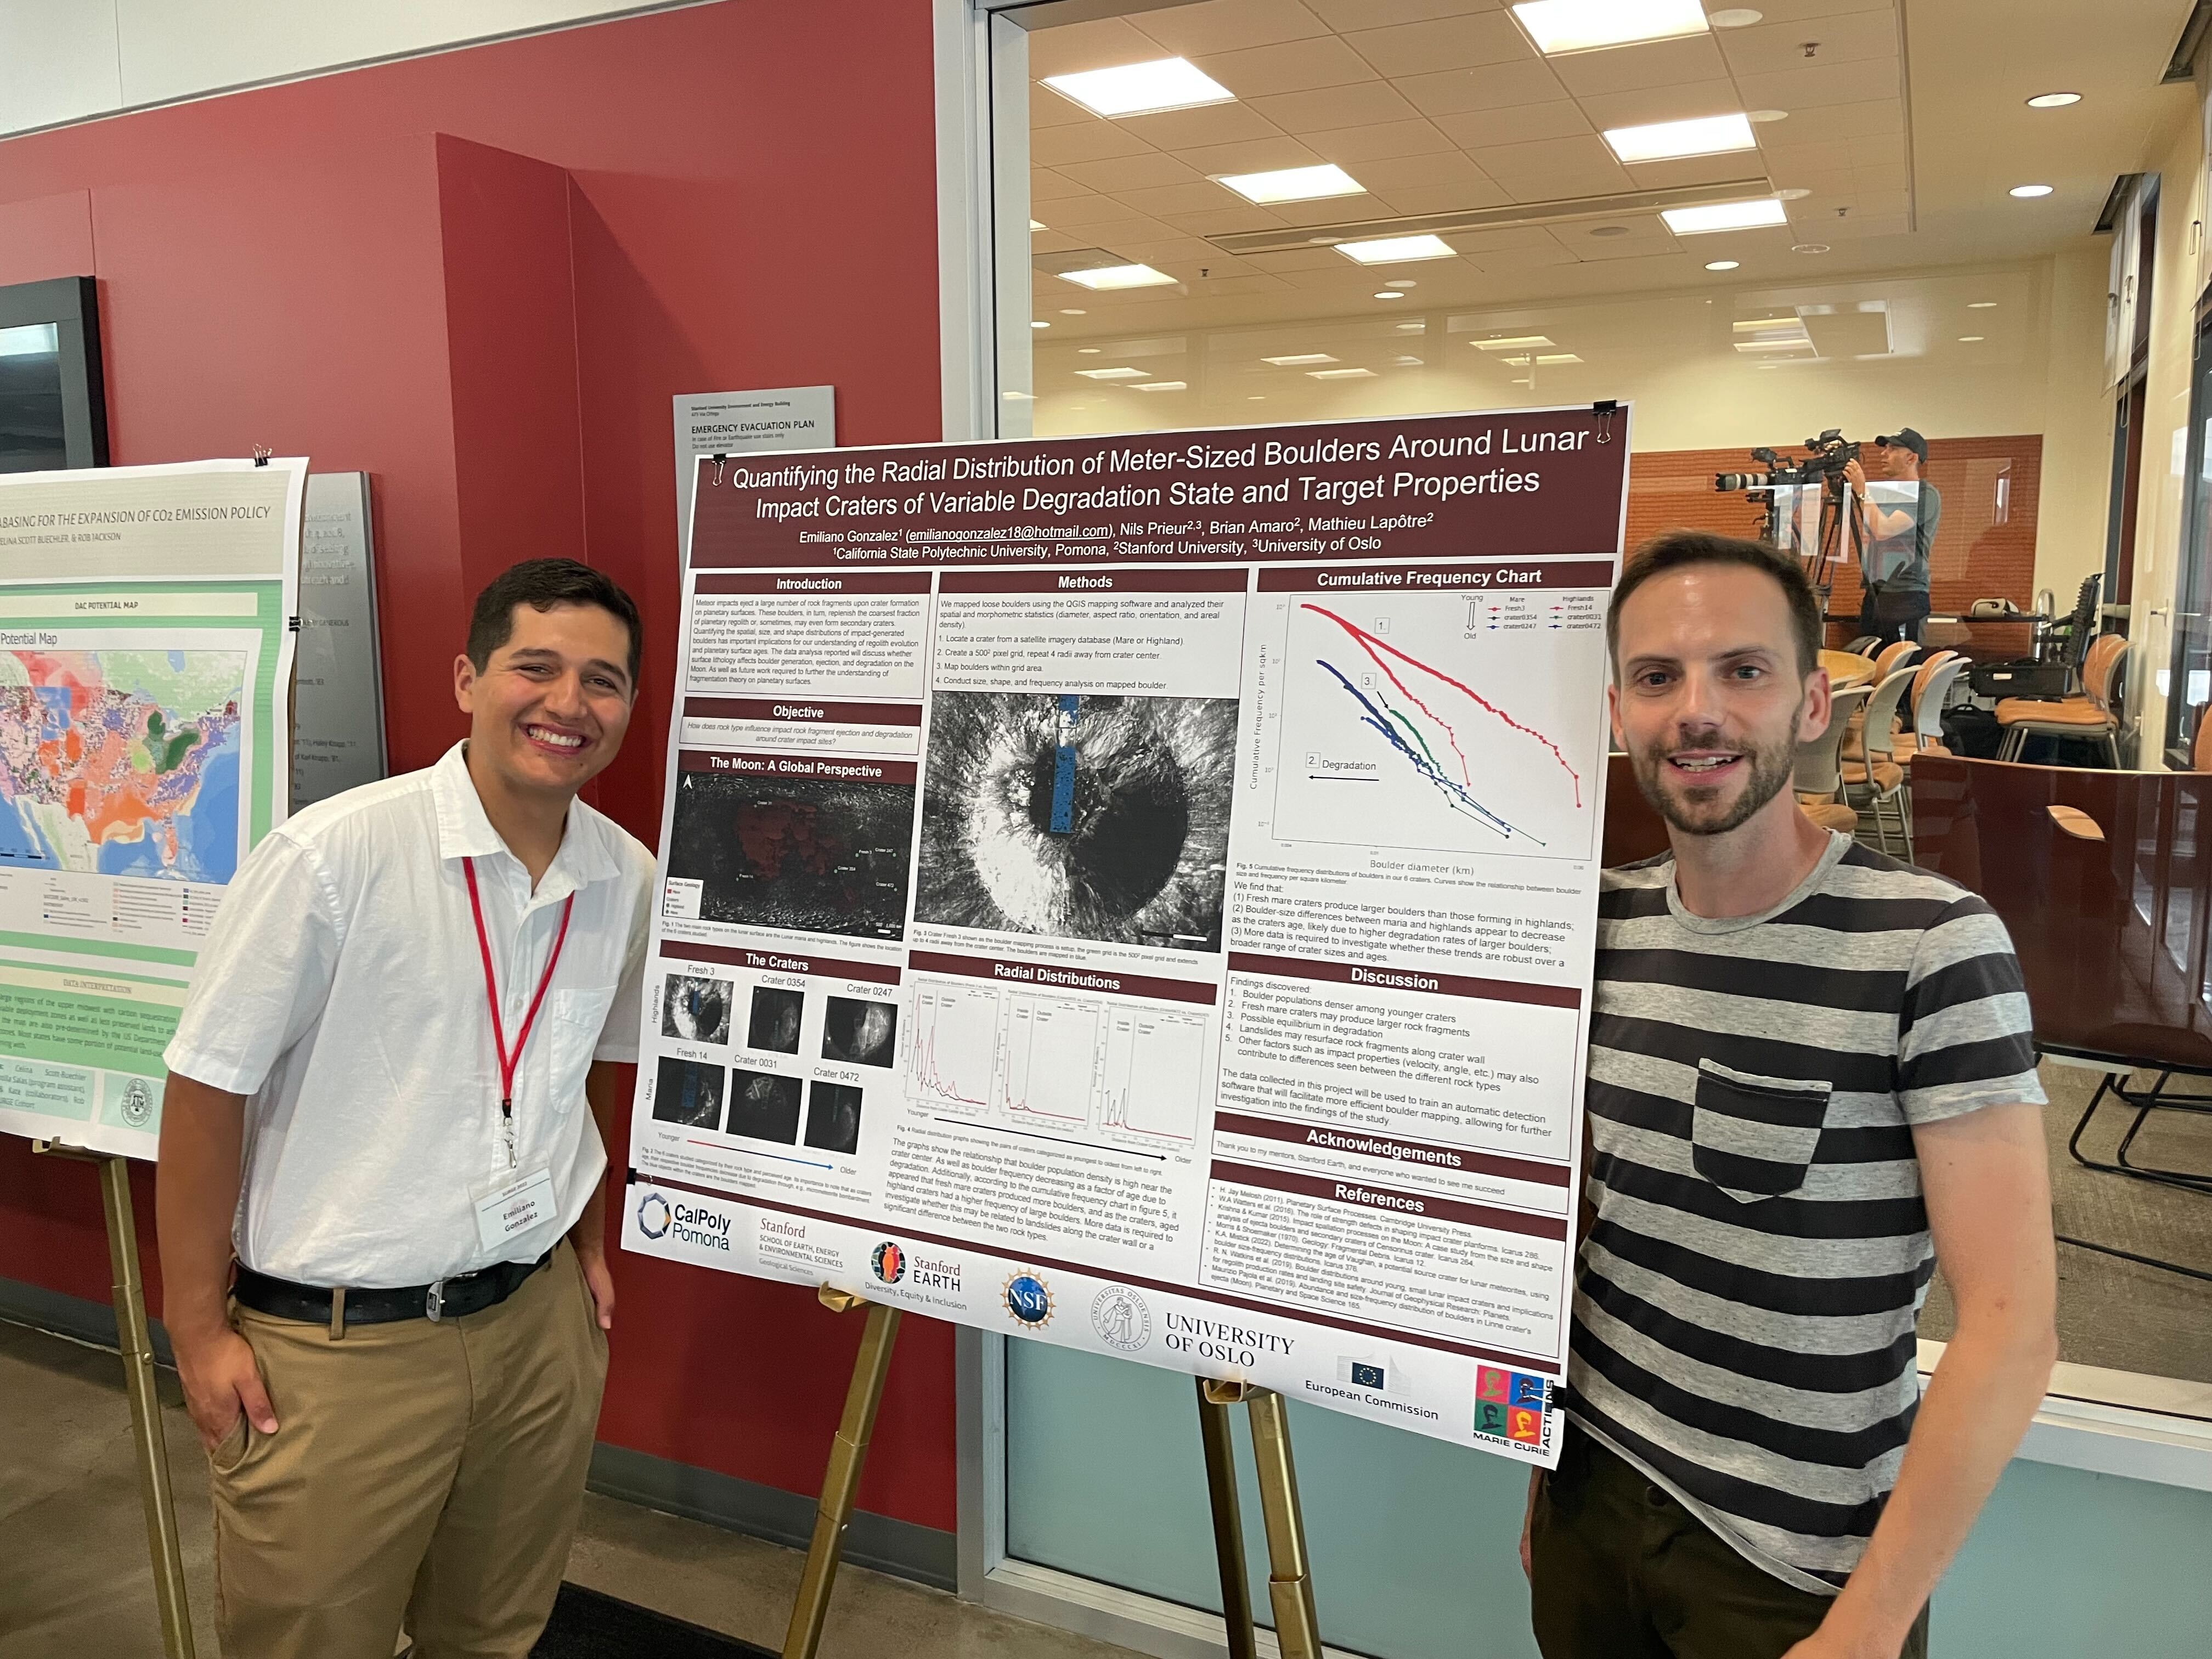 Caption: Emiliano and his mentor, Mathieu! The summer project culminated in a presentation and a poster presentation. Good job Emiliano!
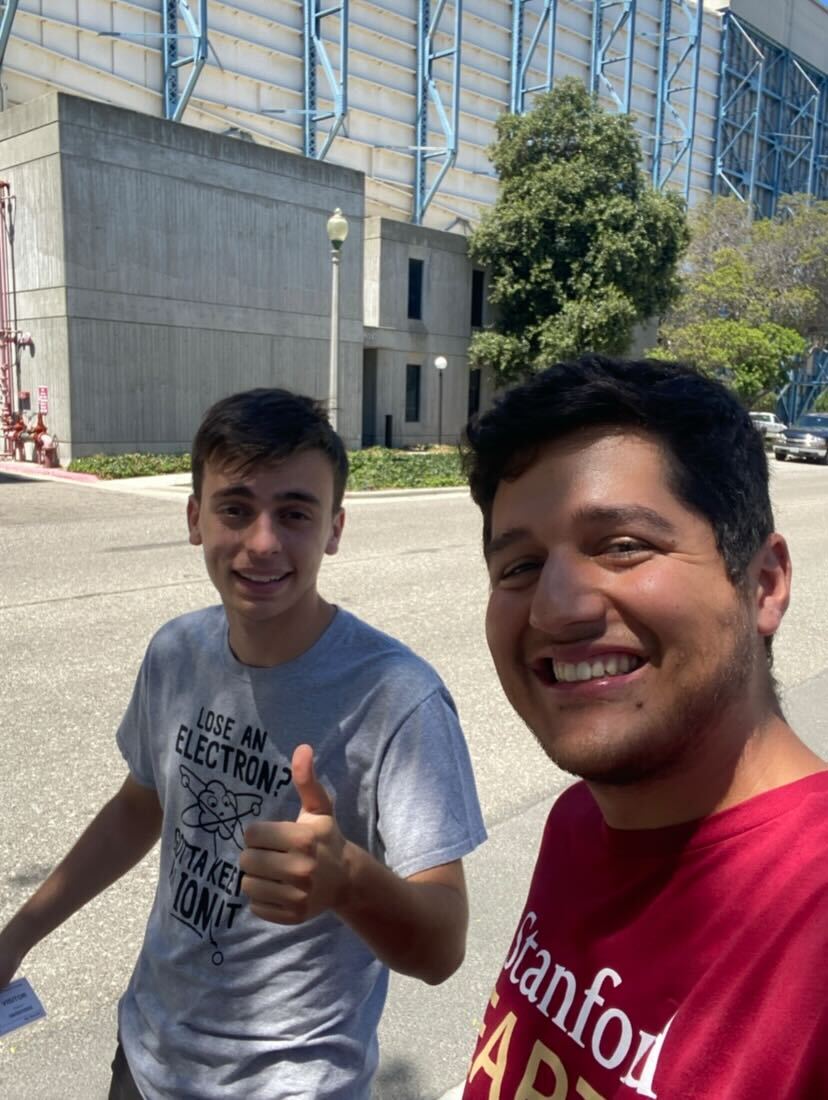
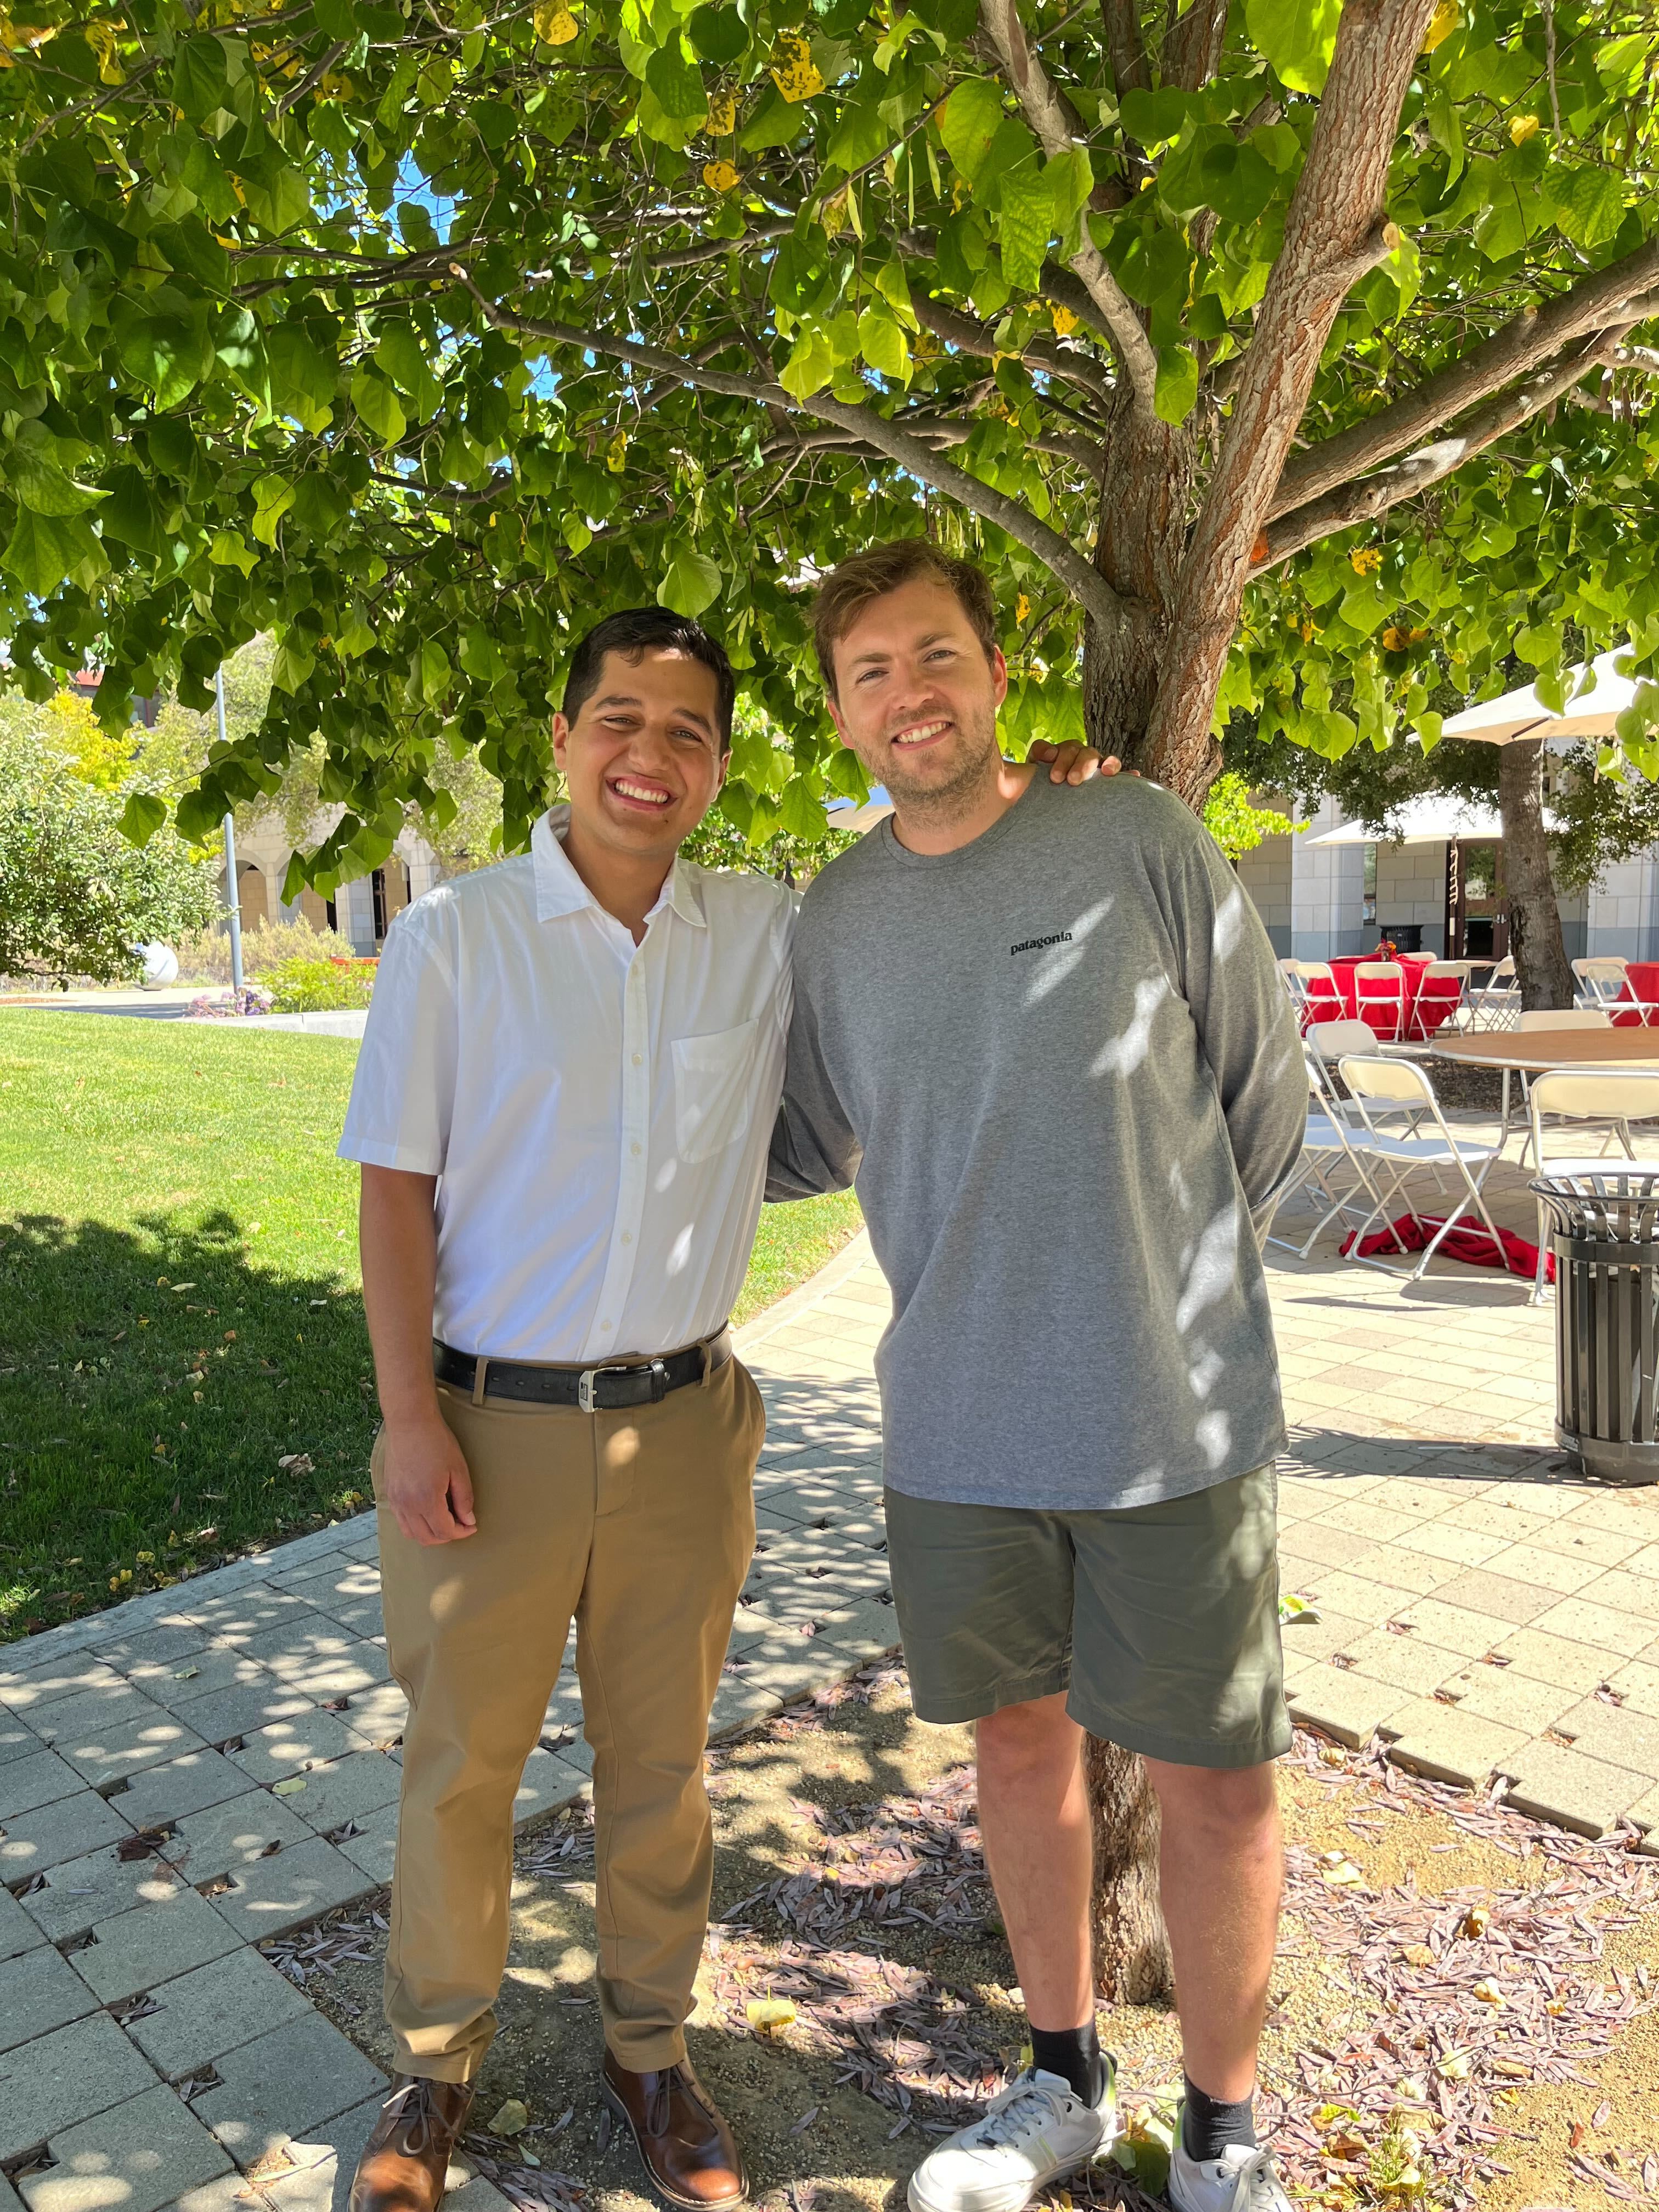 Caption: Emiliano and me. I am proud of what he has accomplished.
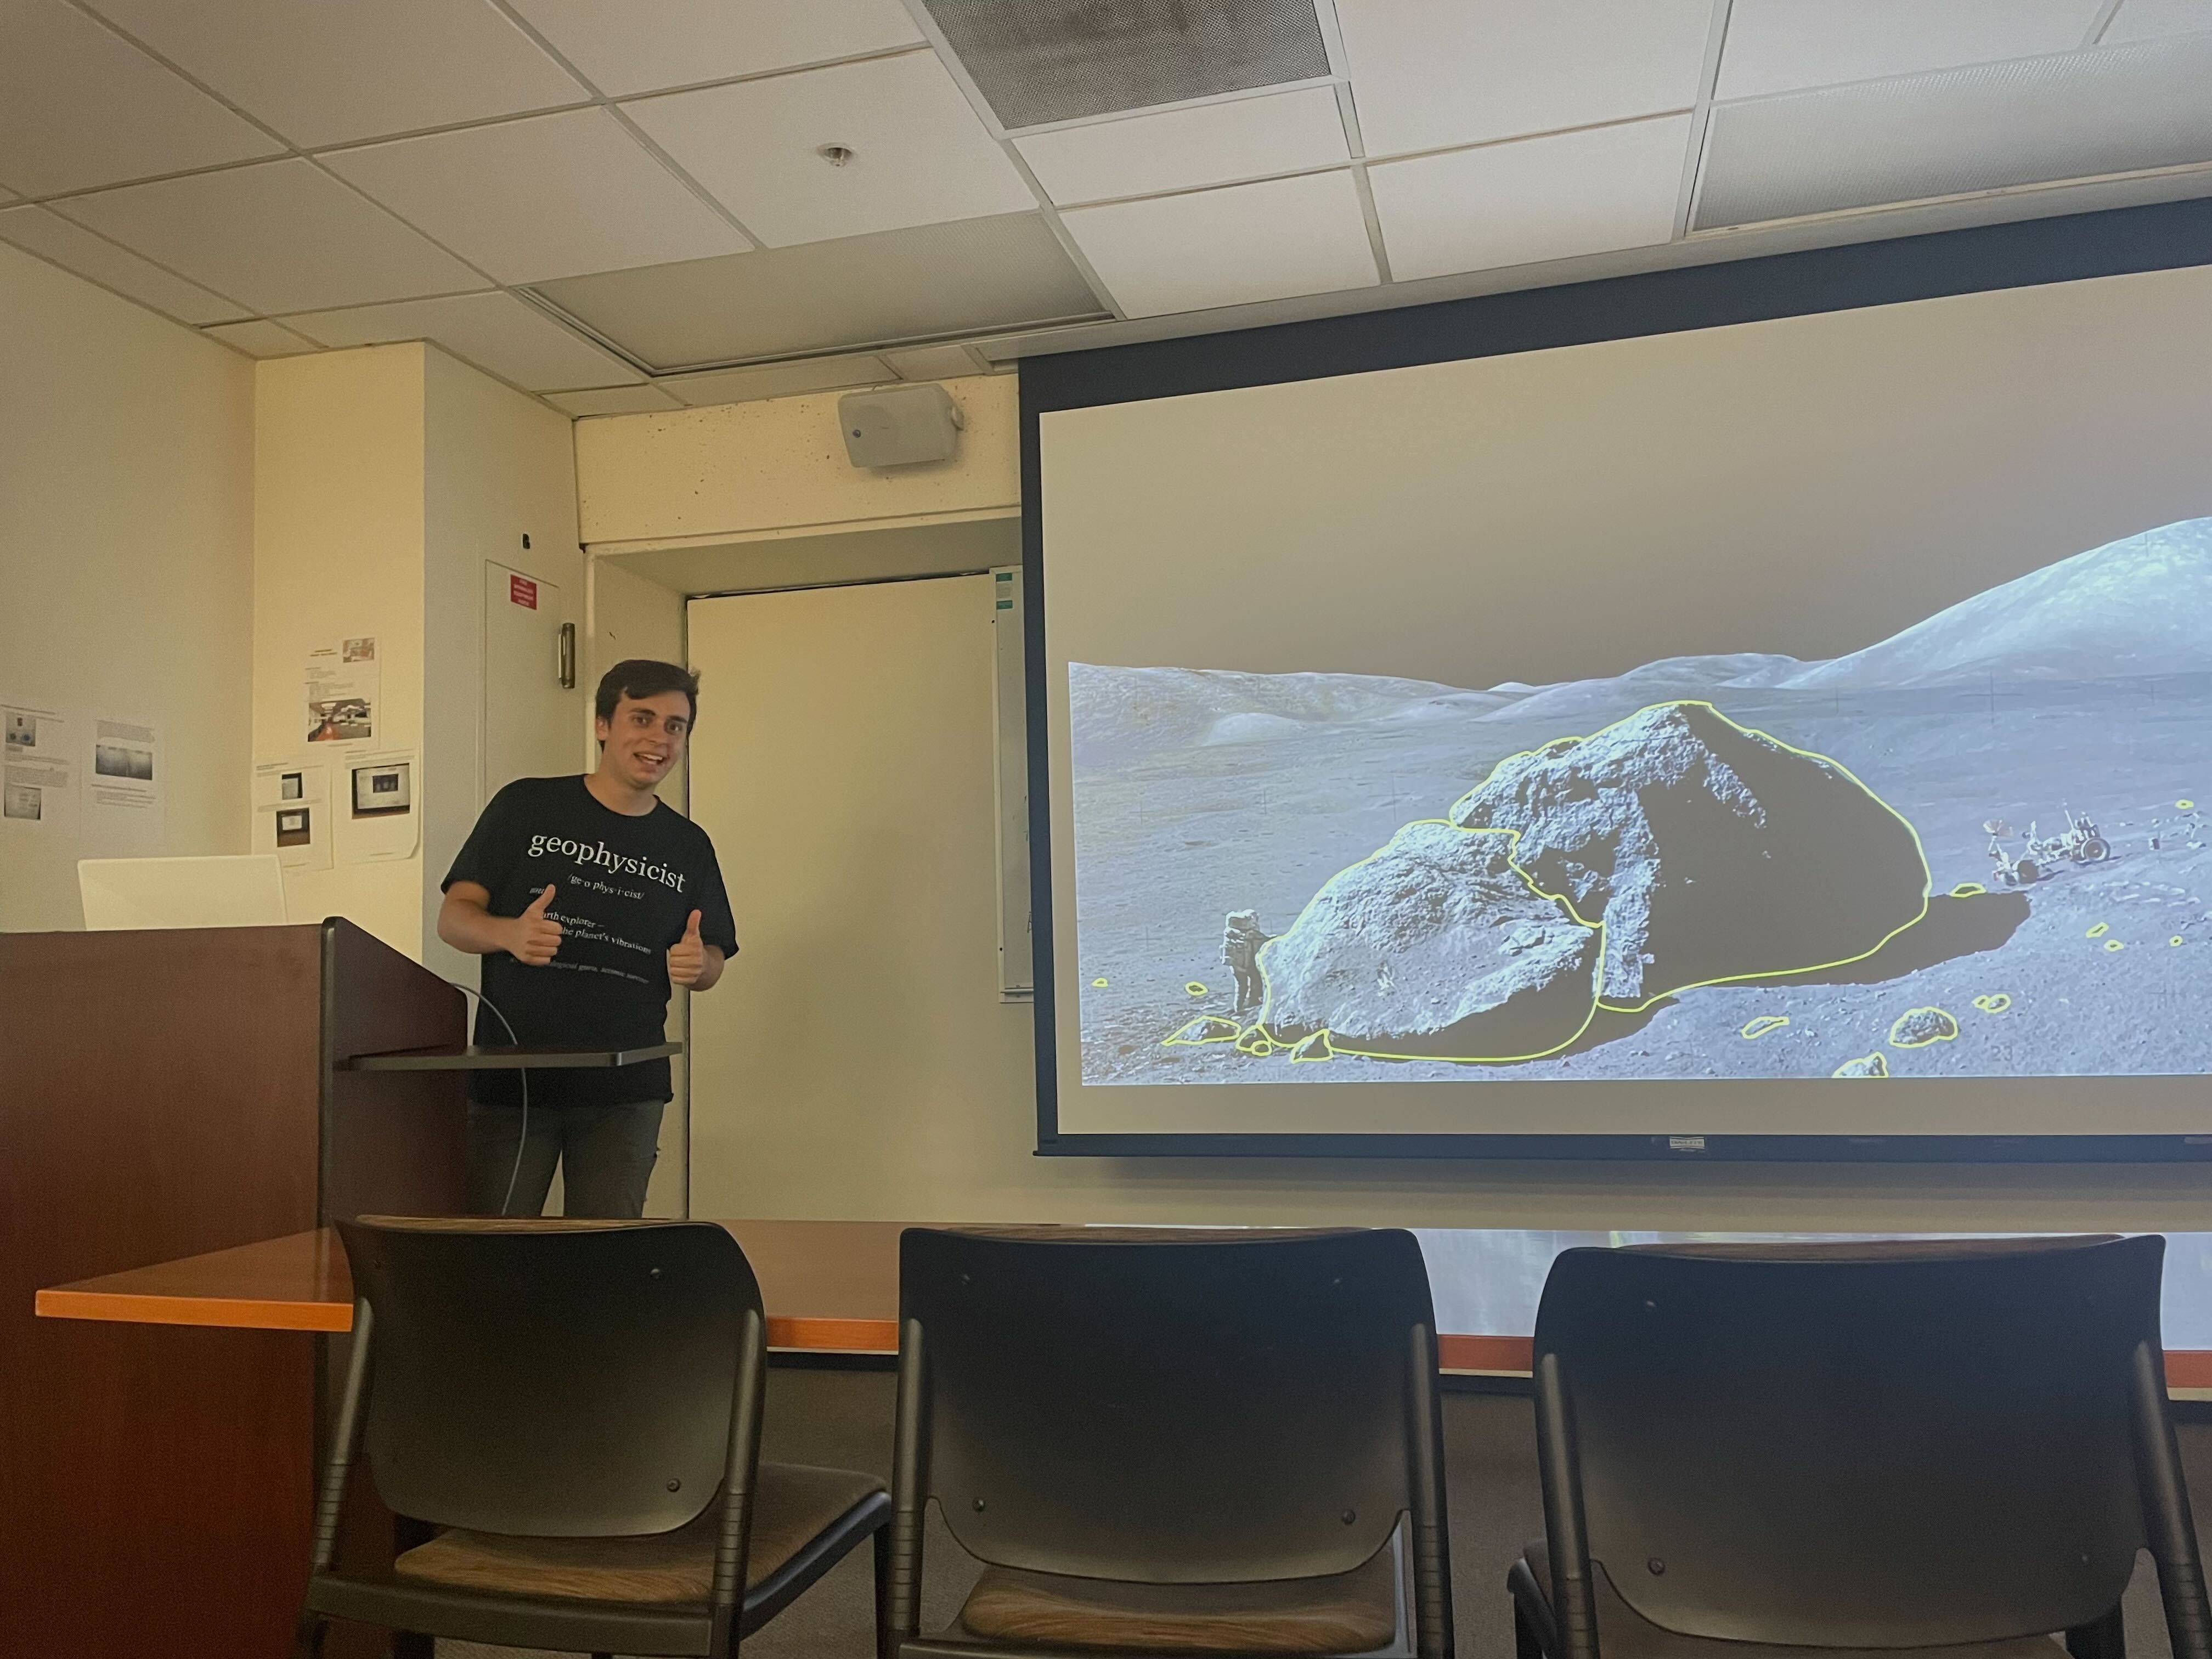 Caption: Brian presenting his results. Brian did an amazing job too!
Published:
Hey everyone! I’m just back from the first drone campaign of the BOULDERING project, and what a weekend it was! The volcanic domes near Mammoth Lakes were absolutely stunning. Here’s a little recap of the adventure:
We started at the South Deadman volcanic dome on Friday evening. It was our test run—everything feels tricky the first time! The northern slope of the dome required a bit of off-piste trekking to reach, and the strong winds didn’t make things any easier. The flight paths were aligned against the wind direction, which drained the drone’s batteries way faster than expected (lesson learned: perpendicular flight paths save battery life). Despite these challenges, we captured some solid drone images that set a good tone for the weekend.
After a long day, we checked into the cozy Innsbruck Lodge in Mammoth Lakes. The town’s small city center had a charming evening market with music and friendly locals—a perfect way to unwind. After a hearty American breakfast the next morning (seriously, they know how to do breakfast!), we headed to the Obsidian Dome.
At Obsidian Dome, we conducted three drone flights throughout the day and measured around 20 boulders. We specifically chose boulders of different sizes to test how well our future boulder detection algorithm can recover them, especially the smaller ones near the resolution limit of the images. After realizing we hadn’t used enough tape to mark the boulders, we doubled down with plenty of bright orange tape to ensure they’d be easily visible in the drone photos.
On Sunday, we returned to the South Deadman dome for a final session. We measured another 15 boulders, captured one last round of drone images, and then made the 4–5 hour drive back to the Bay Area.
The amount of data we collected is incredible. Now it’s time to sit down in the lab, process the images into orthoimages, and digitize the ground truth measurements from the field. This trip was a unique experience—I’ve mostly been a modeler in my research career, so getting out in the field was a refreshing change. It felt amazing to combine the physical and digital aspects of science. I loved every moment of it!
I can’t wait for part 2 of the fieldwork in September. Until then, take care! 😊
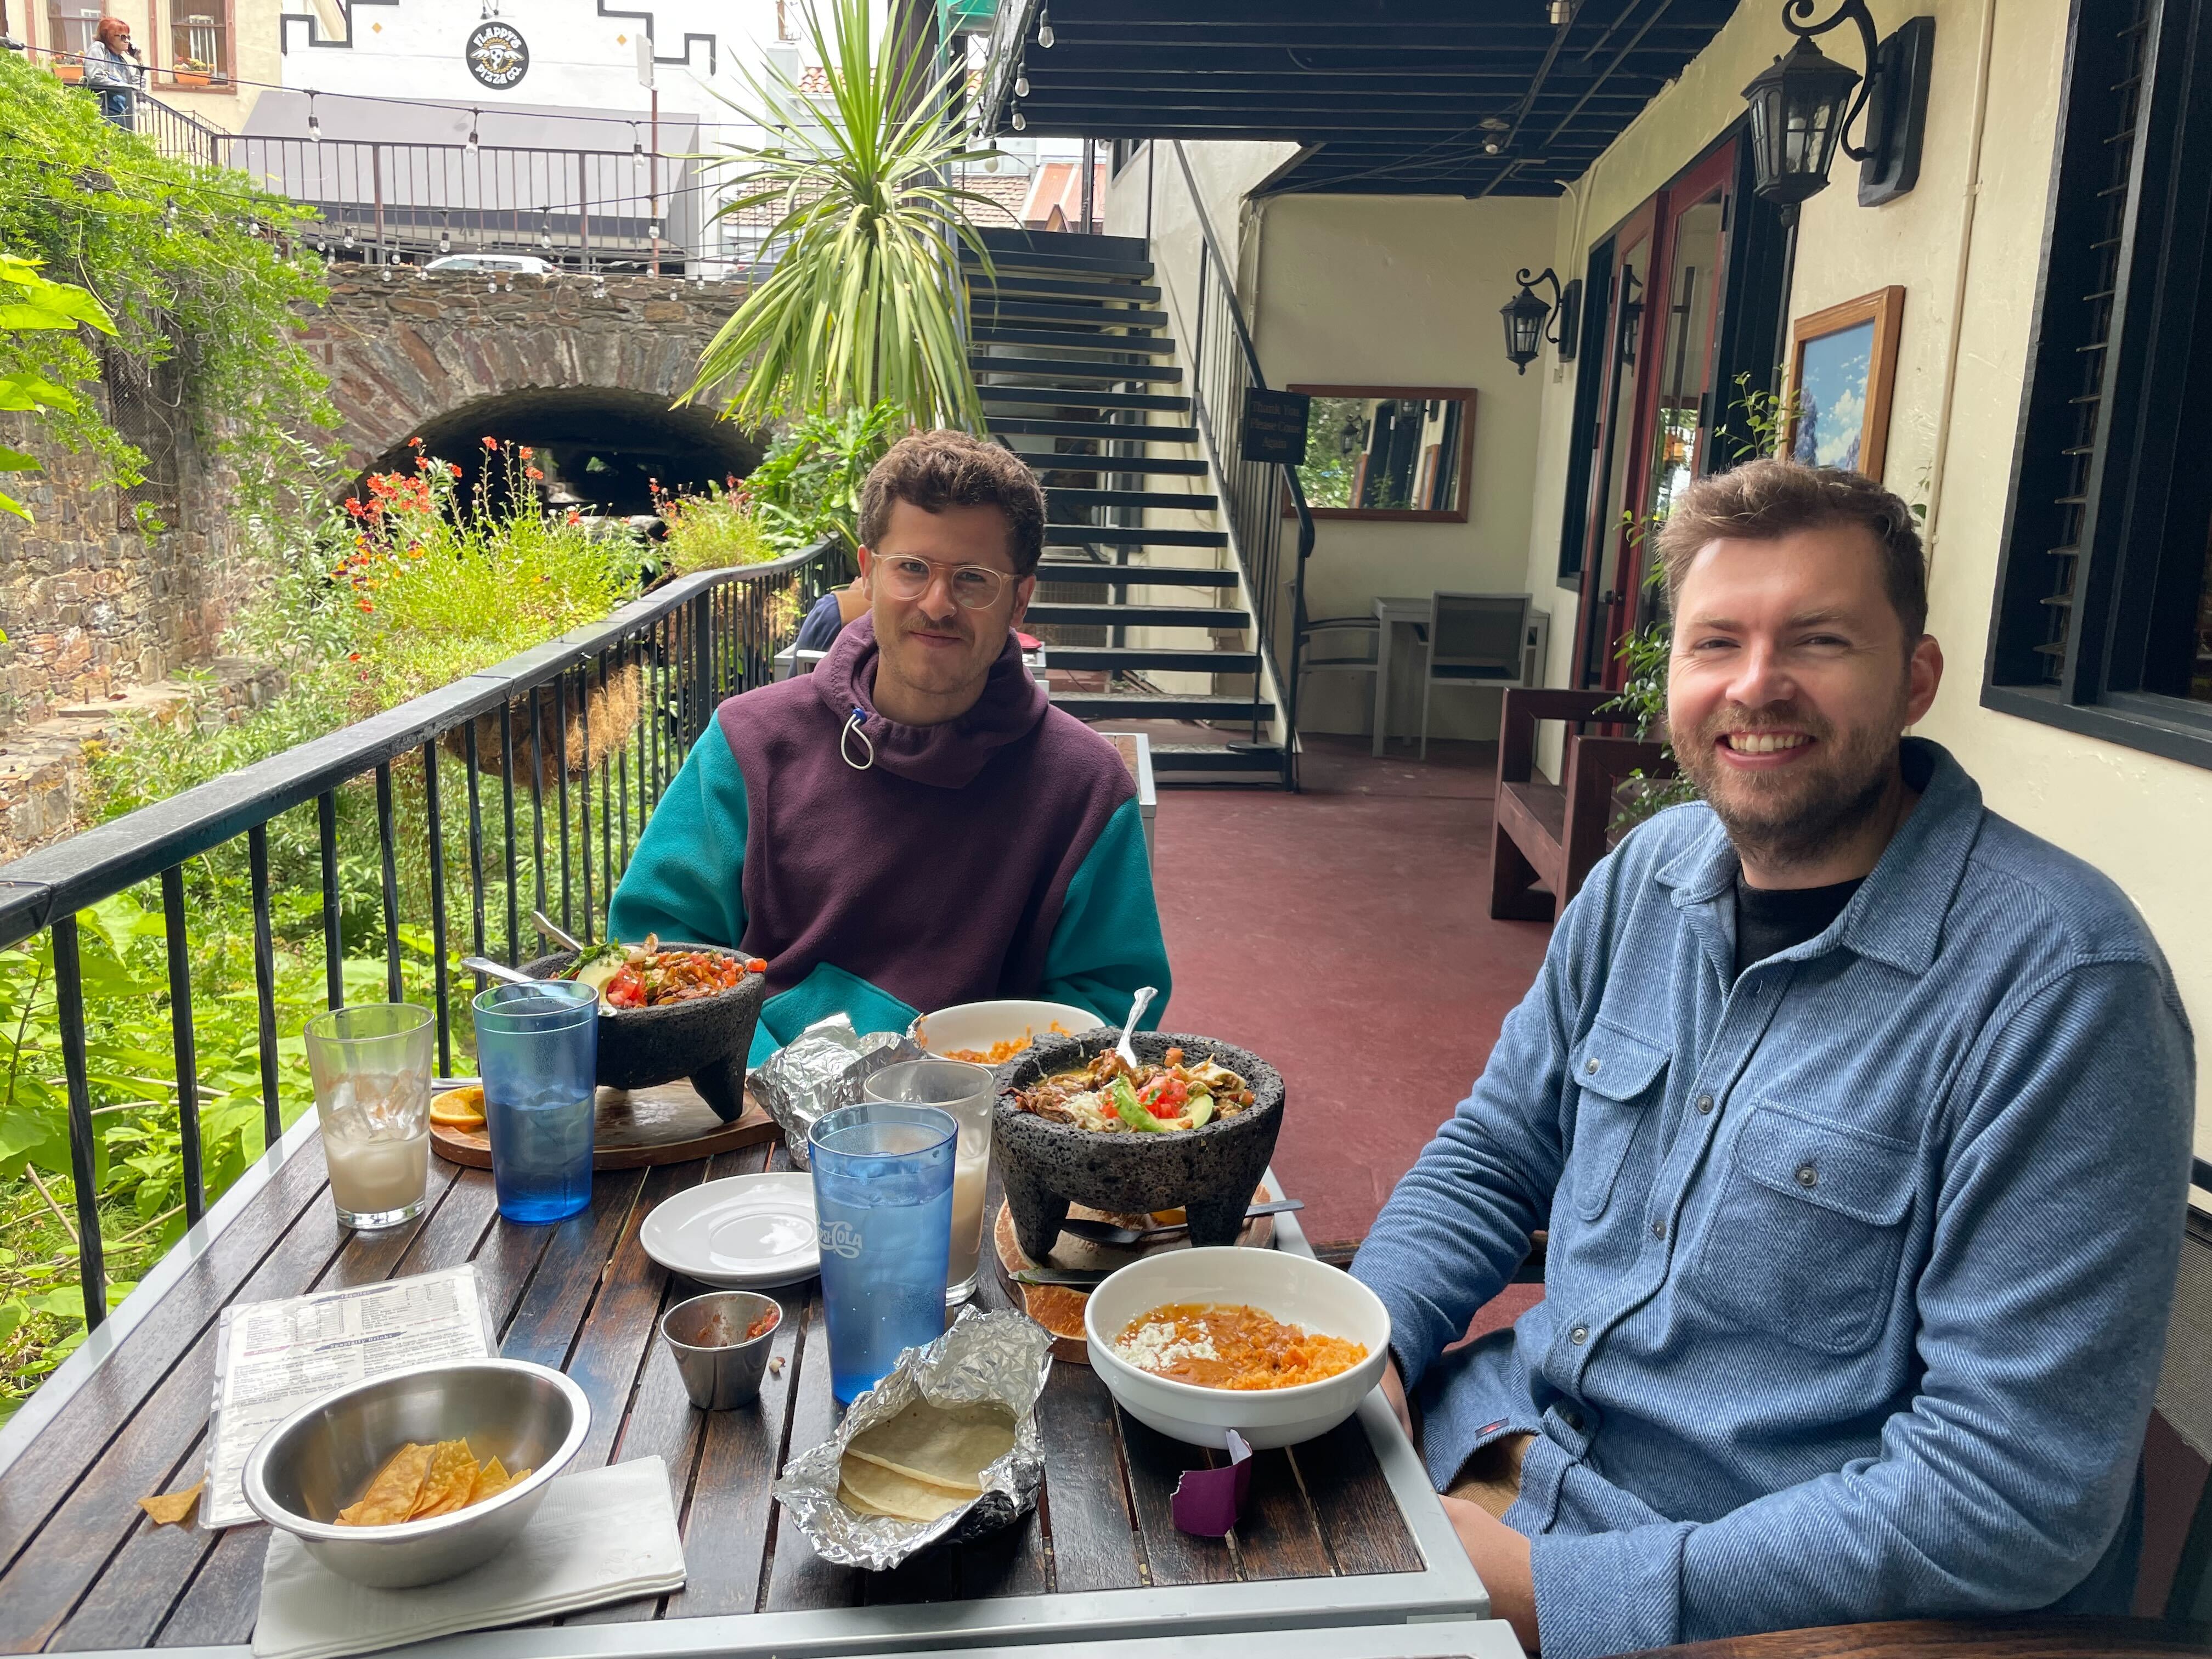 Caption: Lunch stop on the way to fieldwork. Charging up at a Mexican restaurant.
 Caption: First flight with the drone. The winds were strong and only a small area of South Deadman done was mapped, but it was a good test for the two next days of fieldwork!
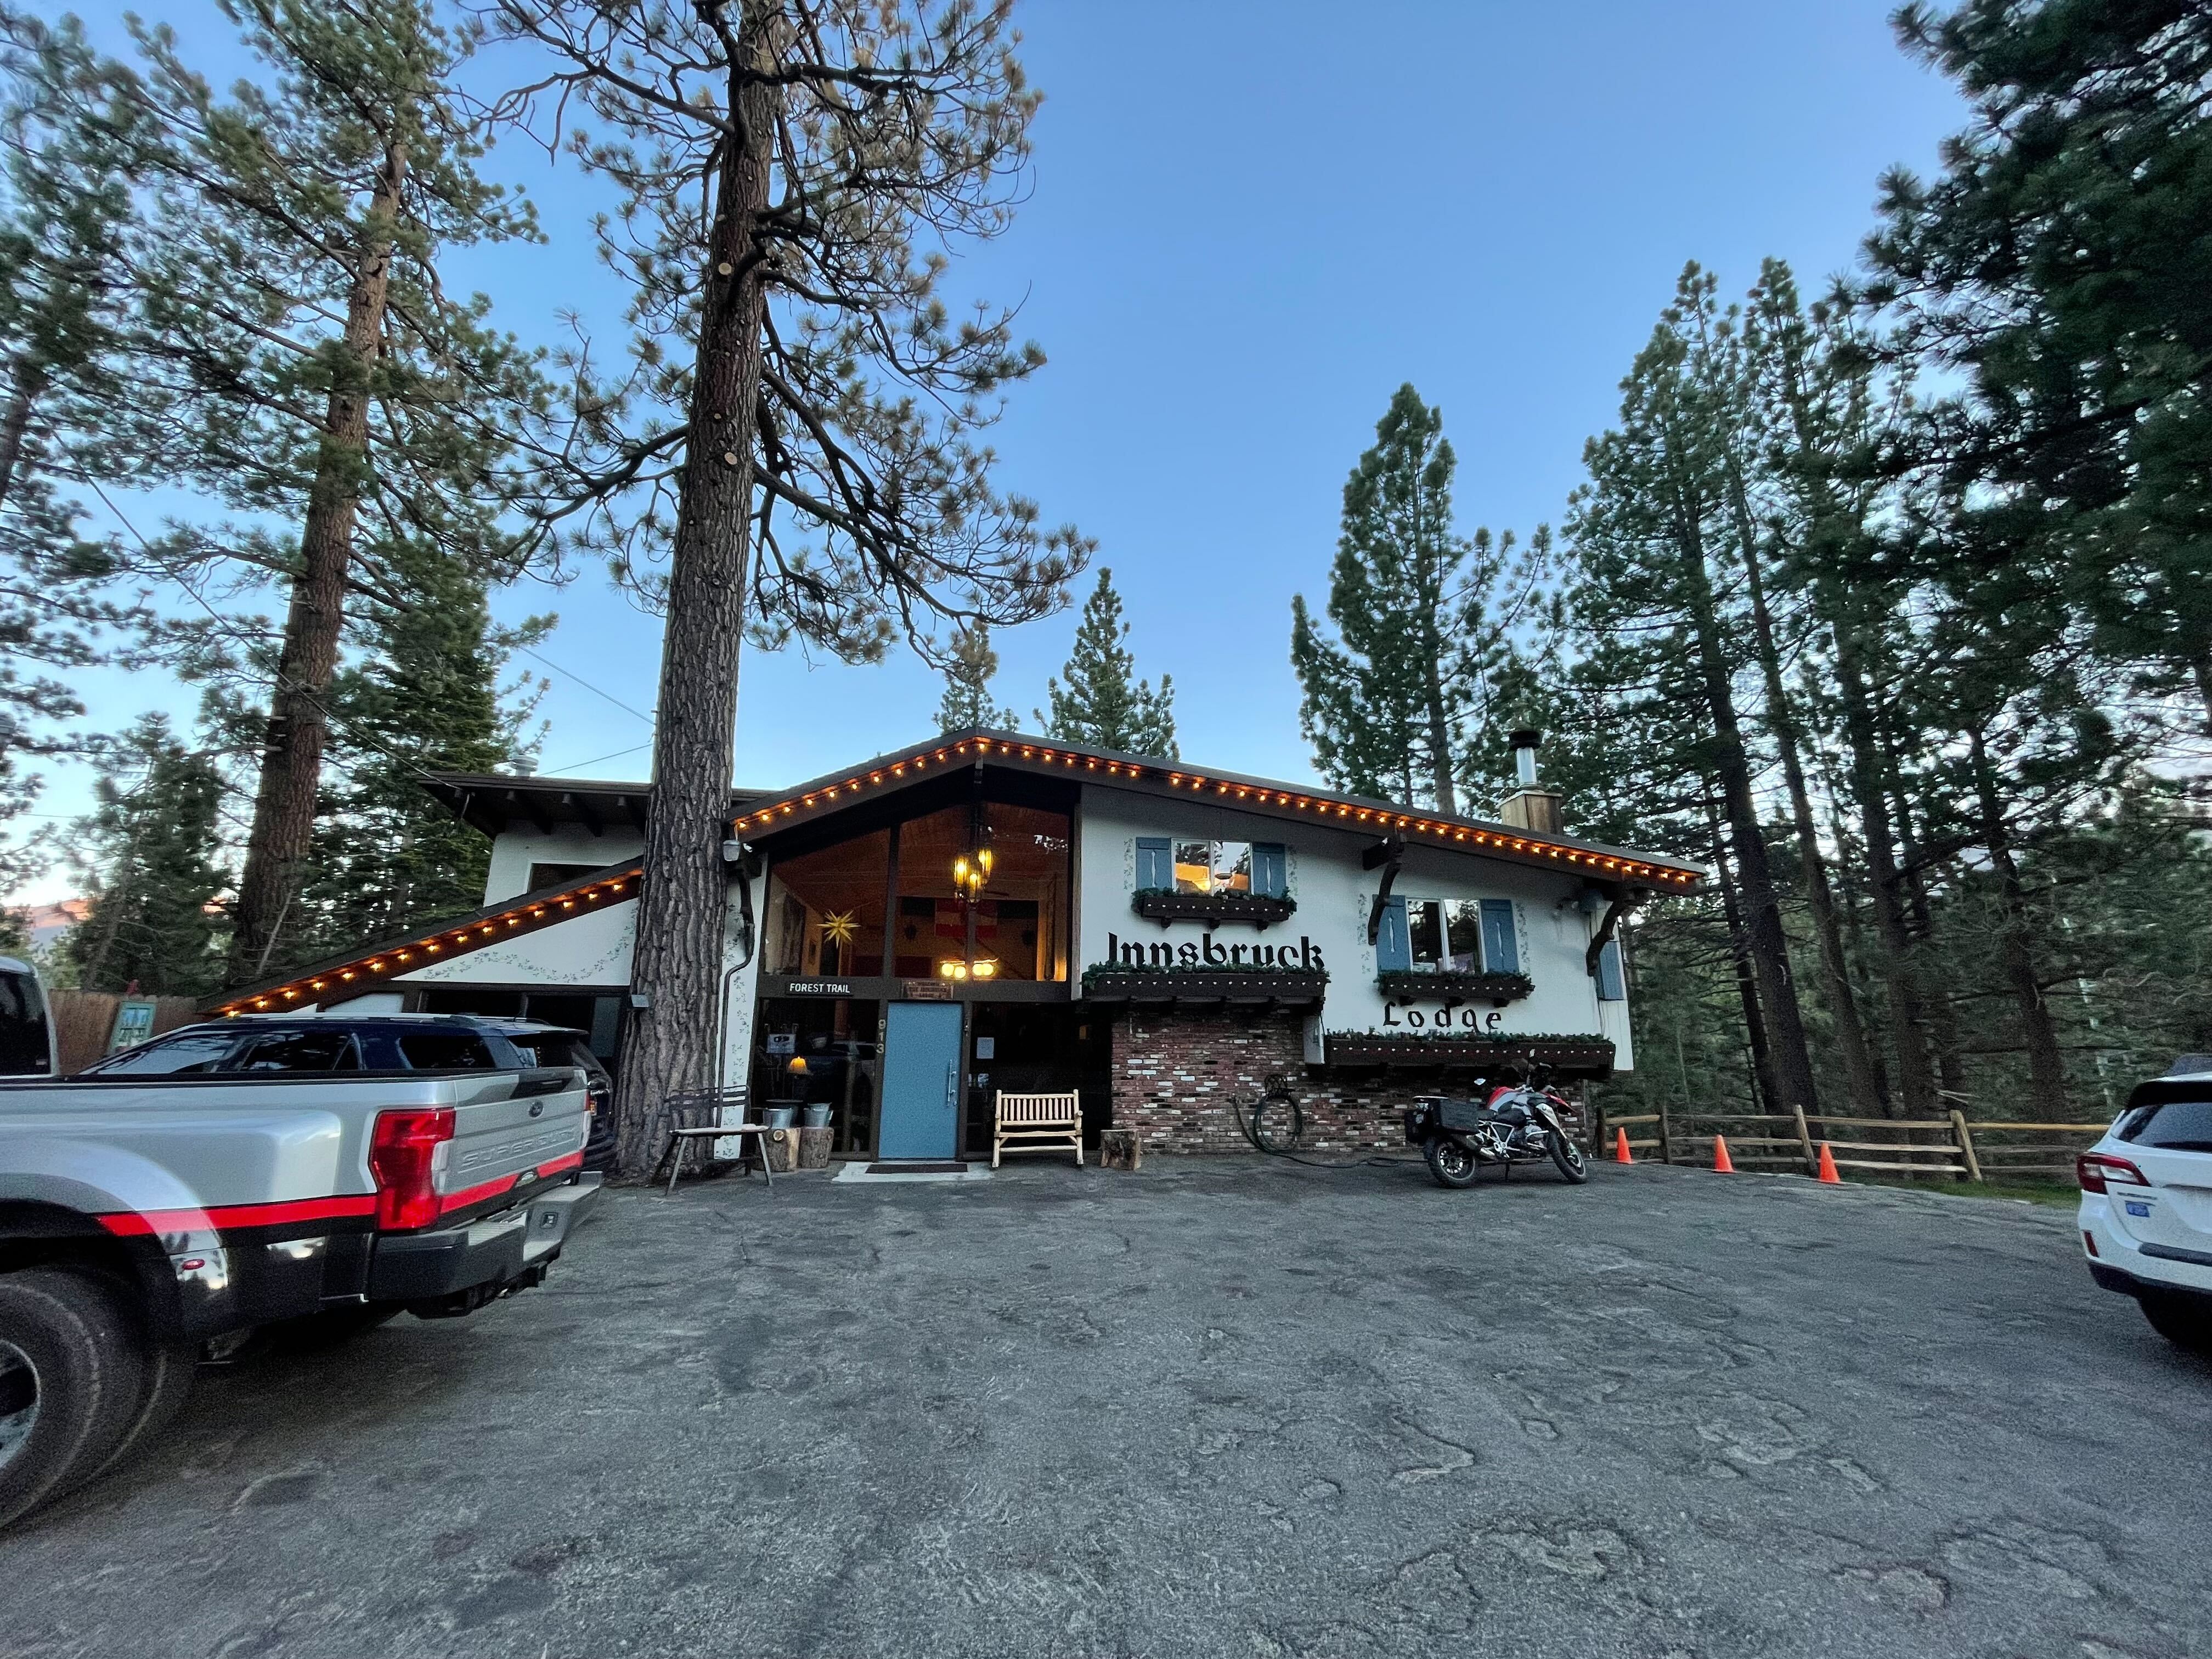 Caption: The Innsbruck Inn, our hotel for the next two nights.
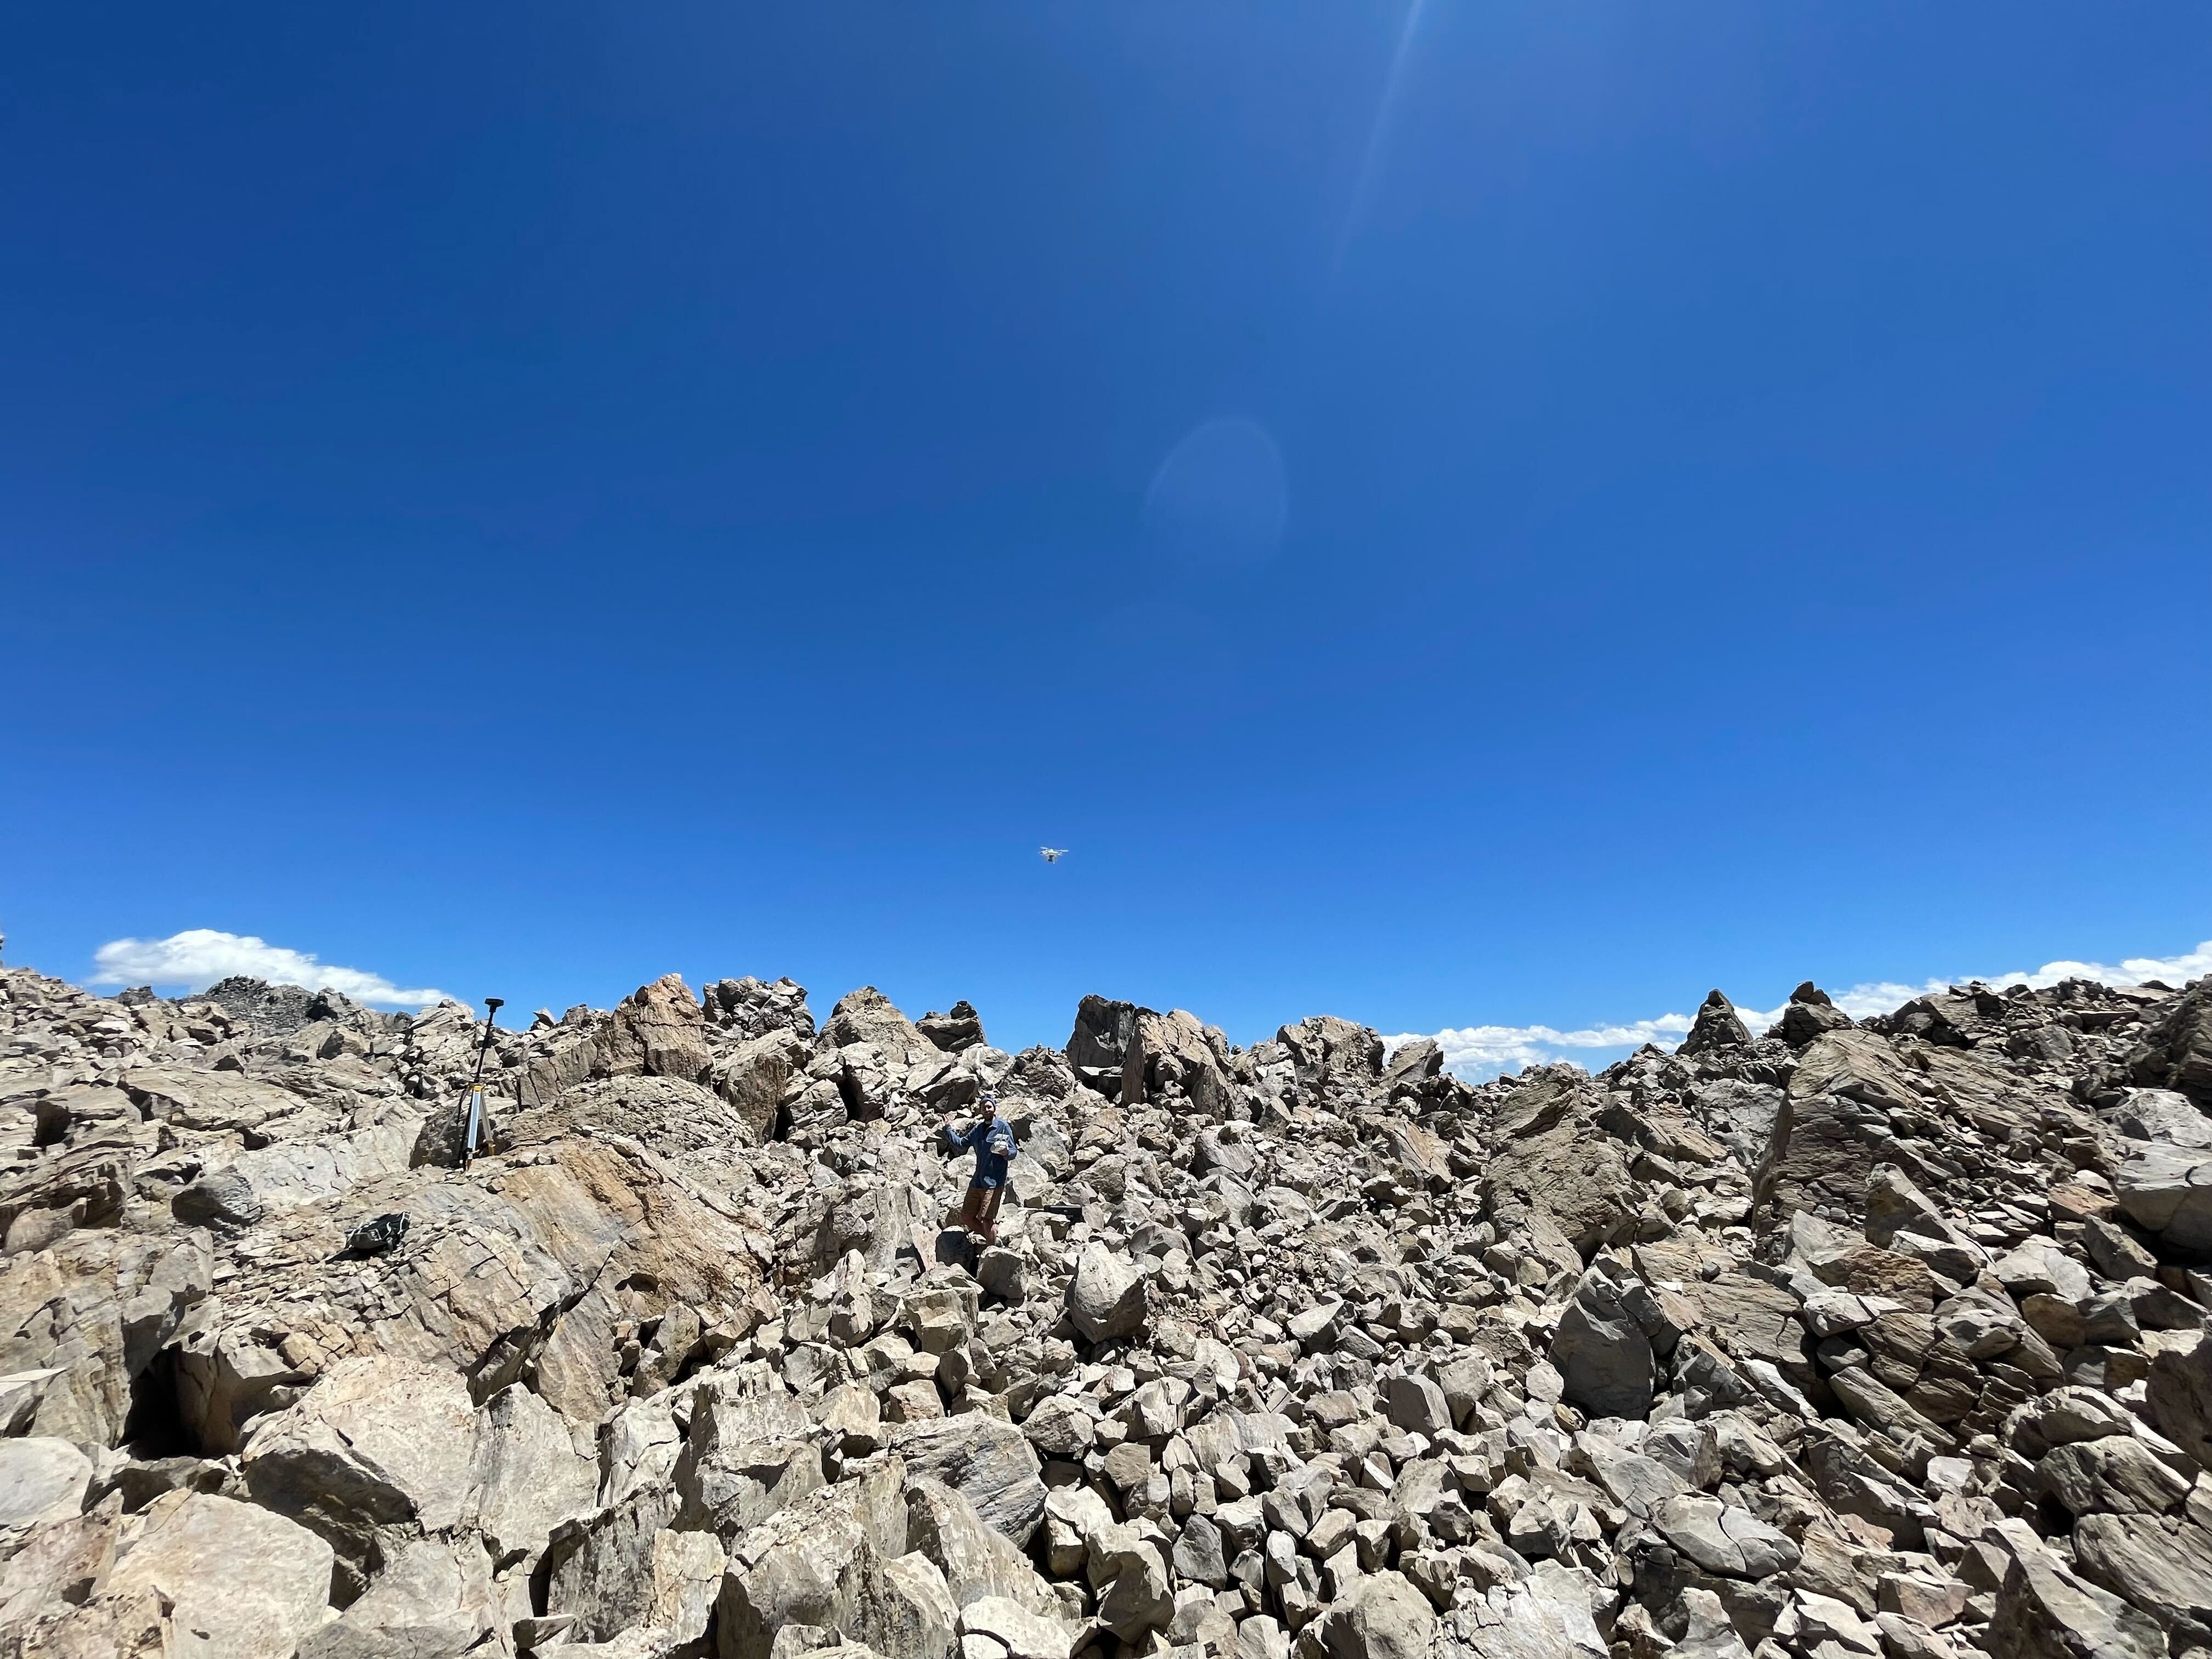 Caption: Look at the crazy boulder density at the Obsidian dome! Difficult to grasp… The drone is up in the air, soon ready to map the area of interest.
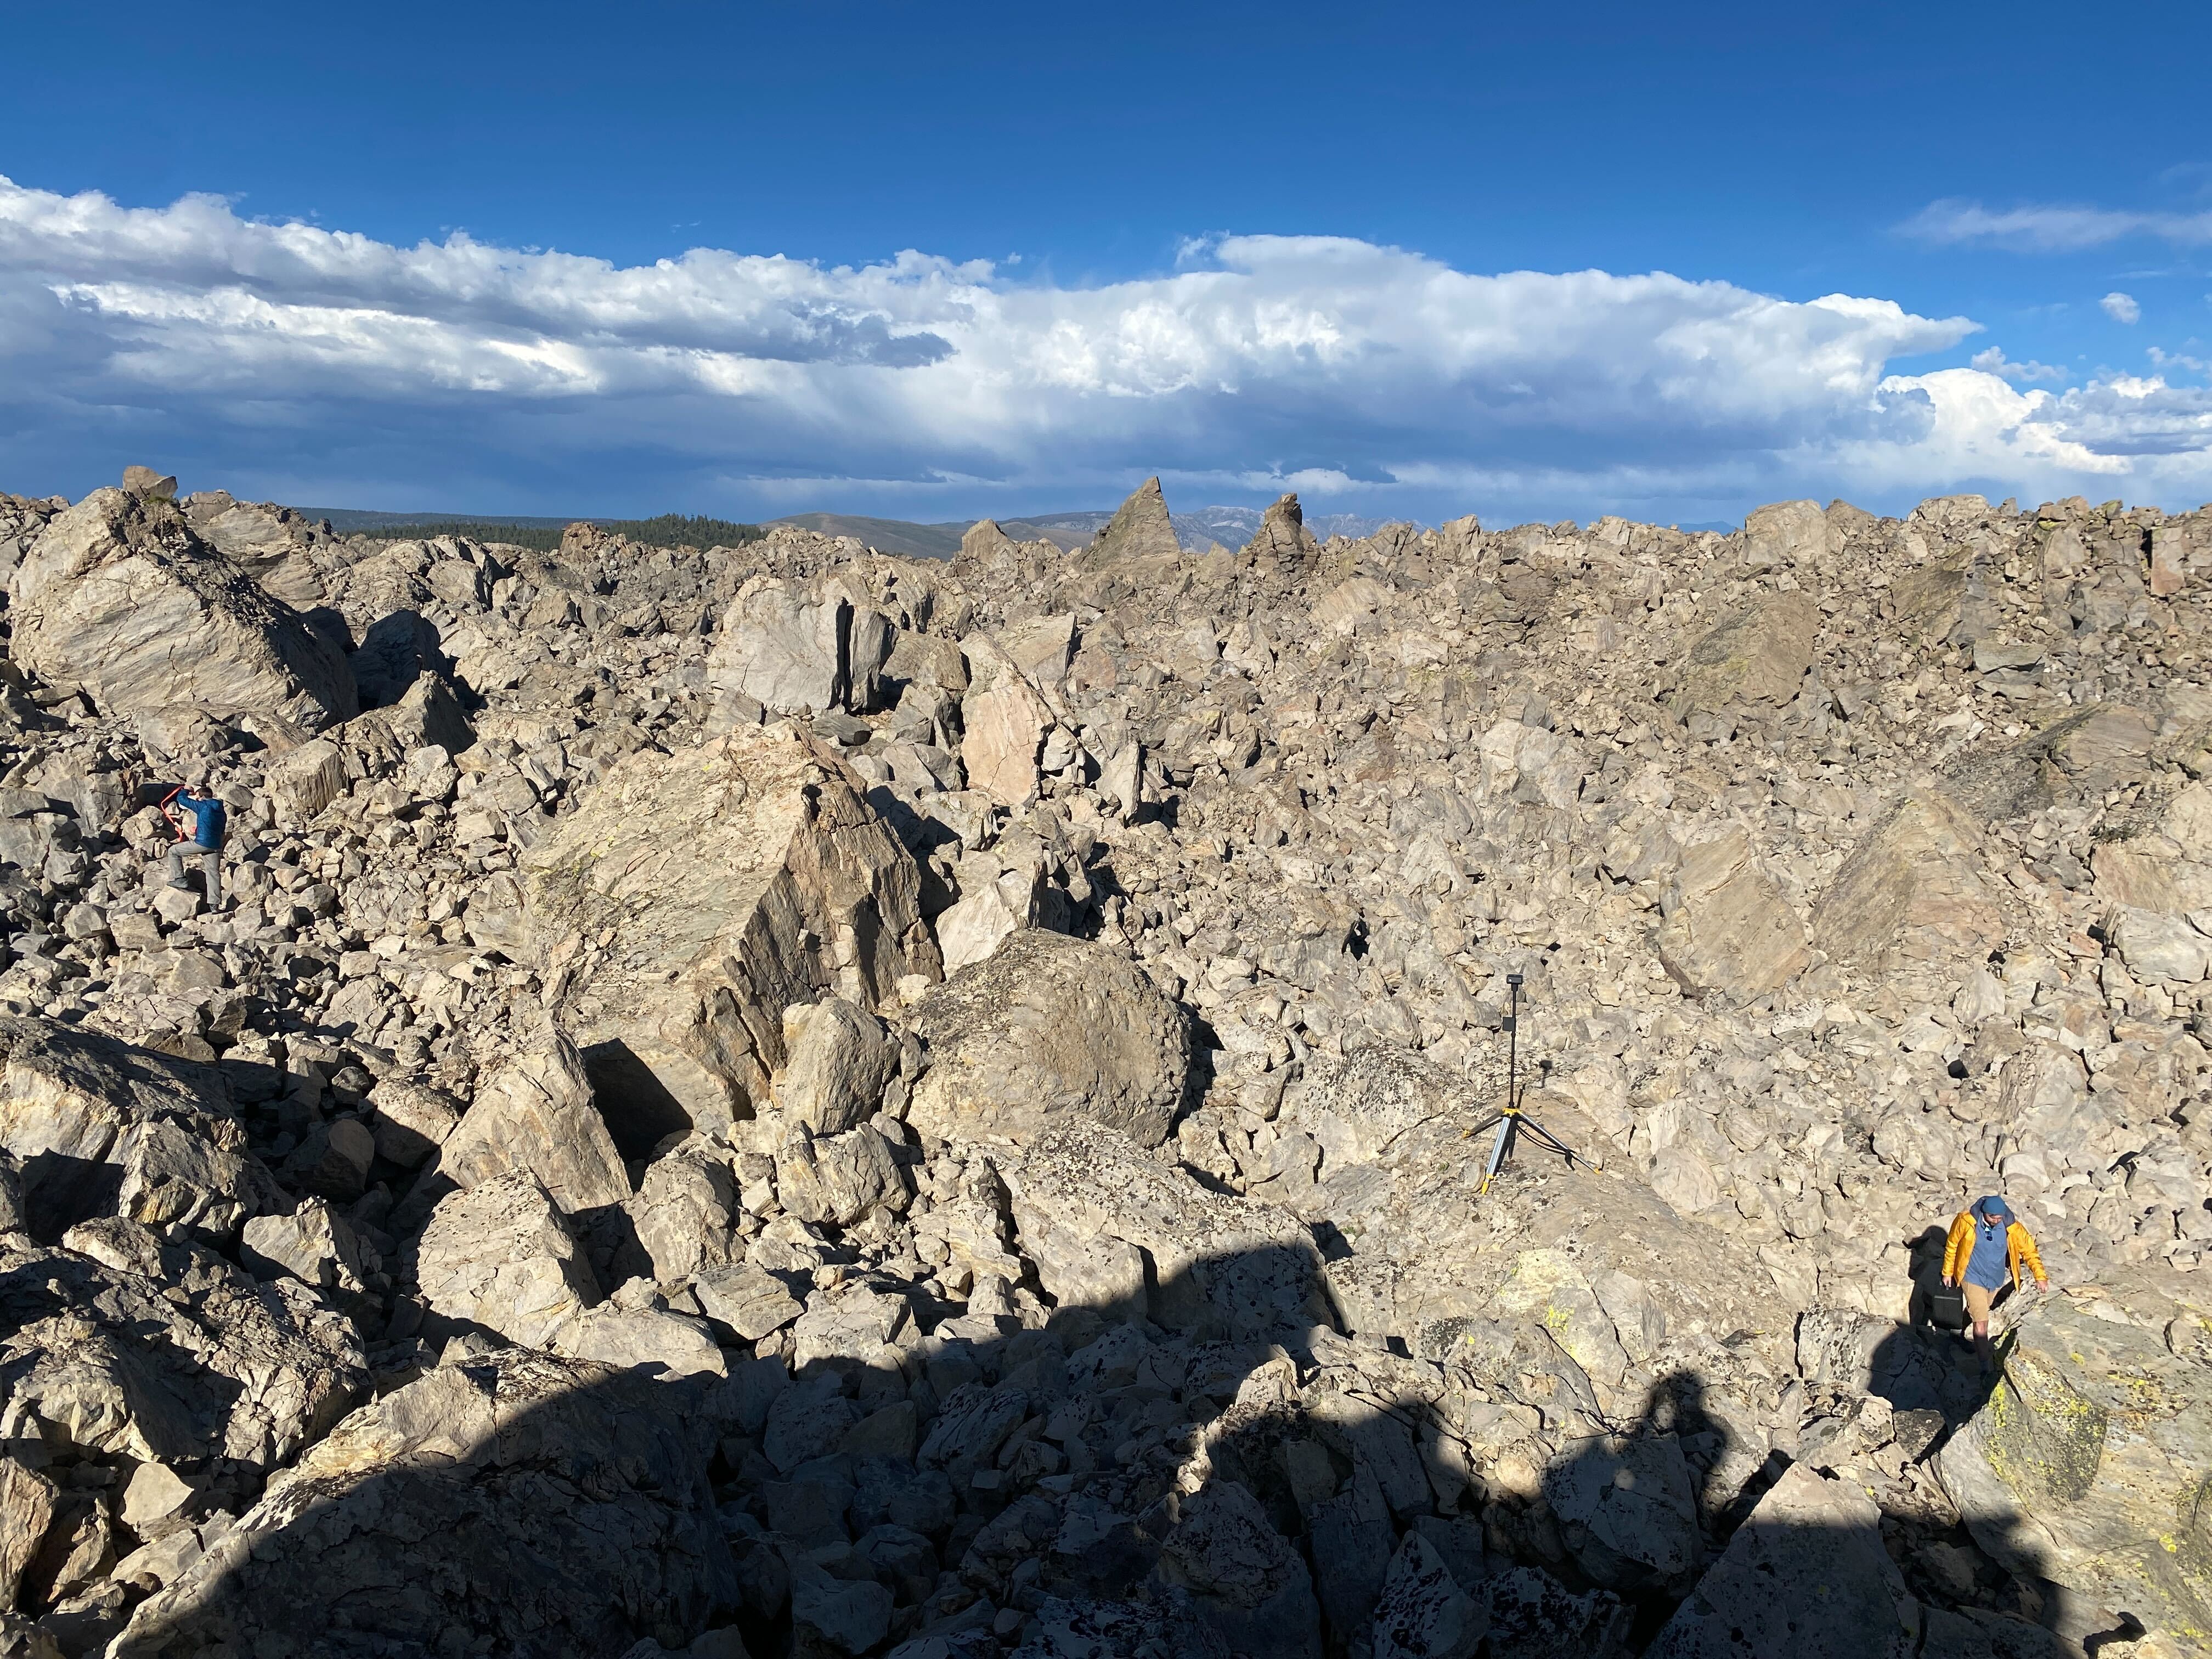 Caption: Another view at the boulder density at the Obsidian dome.
Published:
Bonjour, everyone! The countdown is on—just a few weeks to go until the summer 2022 drone campaign kicks off! After lots of scouting, airspace checks, and careful consideration, we’ve locked in three fieldwork locations. Two of them, the Obsidian Dome and South Deadman Dome, are near Mammoth Lakes in the Sierra Nevada. These volcanic domes were shaped by explosive phreatic eruptions and rhyolitic lava flows, leaving behind fields of boulders that are perfect for the BOULDERING project.
Why these spots? The boulder densities are incredibly high, mimicking the chaotic landscapes we see on rocky asteroids like Itokawa, Bennu, Ryugu, and Eros. It’s a fantastic opportunity to study boulder distribution and characteristics in a setting that’s geologically Earth-based but still relevant to extraterrestrial research.
For the first part of the campaign, from June 19th to 21st, I’ll be joined by Mathieu Lapotre and his Ph.D. student, Michael Hasson. Their help will be invaluable as we collect ground truth data to compare with the boulder morphometry generated by the drone’s automated detection system. It’s critical to validate that the morphometric parameters align with real-world measurements, so having extra hands and expertise in the field will make a big difference.
The third location is a bit further south, in the Sierra National Forest. This site features boulders formed as glacial erratics during the Pleistocene glaciation, with sizes ranging from tens of centimeters to several meters. It’s an excellent complement to the volcanic domes, as the boulder density here is much lower—closer to what we’d expect around small impact structures (100–200 meters across on the Moon) or further away from the rims of larger craters. I plan to head there in September, and guess who’s joining as my field assistants? My parents! It’ll be a fun way to involve them in my work, and we’re planning to sneak in a visit to Yosemite National Park while we’re at it.
On the tech side, everything is ready to go. The drone is updated with the latest drivers, all systems have been tested, and flight paths are pre-programmed. Now it’s just a matter of waiting for launch day. Can’t wait to get out there and start gathering data. Let’s get this campaign rolling!
Stay tuned for updates, and wish me good weather! 😊
Published:
Hey everyone! Big milestone: I attended the Lunar and Planetary Science Conference (LPSC)—the first conference of the BOULDERING project. The LPSC abstract deadline sneaks up early in January, and though my results were still in their infancy, I decided to go for it. My abstract, titled “A Large Training Dataset of Boulder Sizes and Shapes as a First Step Towards the Automated Detection of Rock Fragments on Planetary Surfaces,” focused on the data I’ve labeled so far, the challenges encountered, my plans, and how our method stacks up against existing approaches. It felt like the perfect way to introduce myself and the project to the planetary science community. A “Hello, I’m Nils, and this is BOULDERING” moment!
My abstract was accepted as a poster presentation—yay! My goal leading up to the conference was to train a reasonably robust version of the Mask R-CNN model, study its predictions, and include the results in my poster. Easier said than done! For those unfamiliar, most deep learning models (like Mask R-CNN) are originally trained on straightforward datasets—think photos of cats, cars, or human faces—not satellite images of boulders at the very edge of image resolution. This required a lot of customization, like tweaking the model’s parameters to suit planetary data.
The default parameters? Forget it. I had to dig into the Detectron2 documentation and adjust things like image scales, anchor sizes, and learning rates to handle small boulders effectively (here’s the config reference for those curious: Detectron2 Config). After a lot of trial and error, I trained the model using labeled data from the western side of the Censorinus crater. For testing, I made predictions on the eastern side—a region the model had never “seen.”
The results? Far from perfect! Many boulders were missed, but the model still managed to detect some. Importantly, it hinted at areas where I needed more labeled examples. For instance, if the model consistently failed to detect boulders with certain characteristics, it essentially “asked” for more examples of that type. This feedback loop—using predictions to improve the training dataset—was a promising first step.
The conference itself was fantastic. The planetary science community is incredibly supportive, and I received great feedback on the project. I also connected with researchers using deep learning for entirely different applications, which was a goldmine for inspiration. Seeing how others approach their challenges made me think of new ways to tackle mine.
All in all, a productive, inspiring, and fun experience. The BOULDERING project is officially on the map! Looking forward to implementing some of the lessons learned and improving those predictions. Until next time—take care! 😊
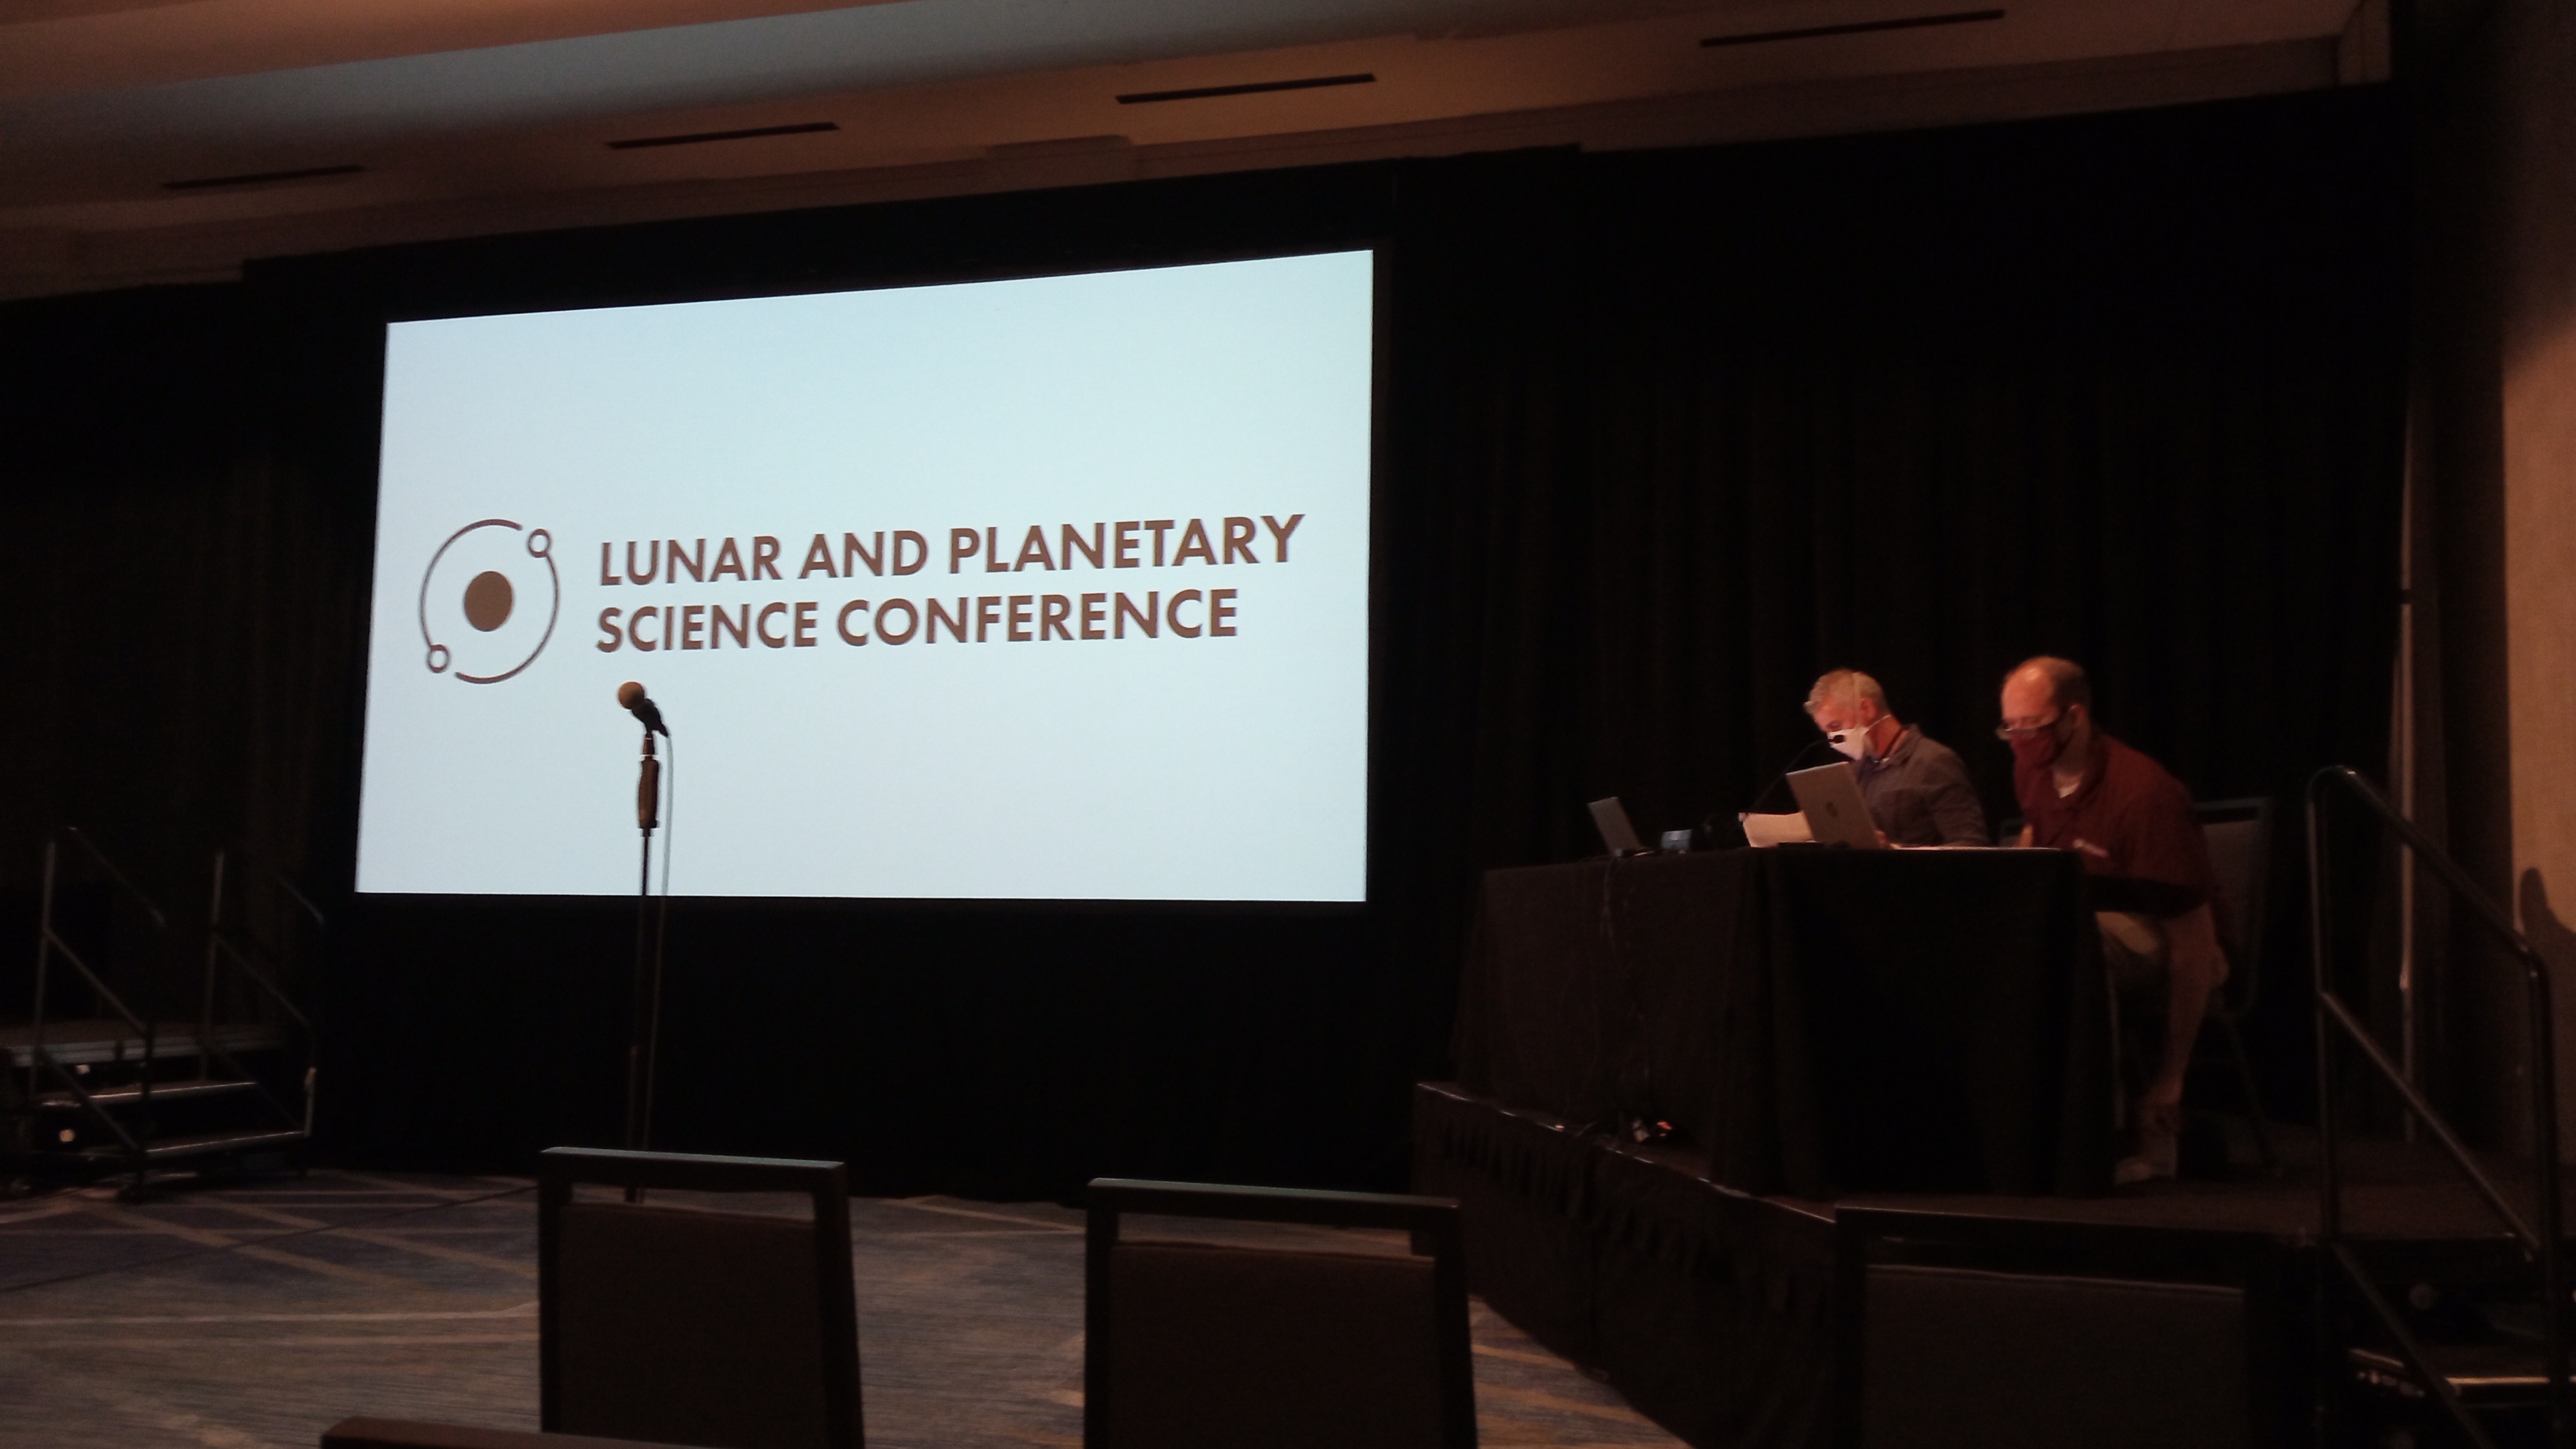 Caption: Let’s the conference begins, Woodlands, Texas (US).
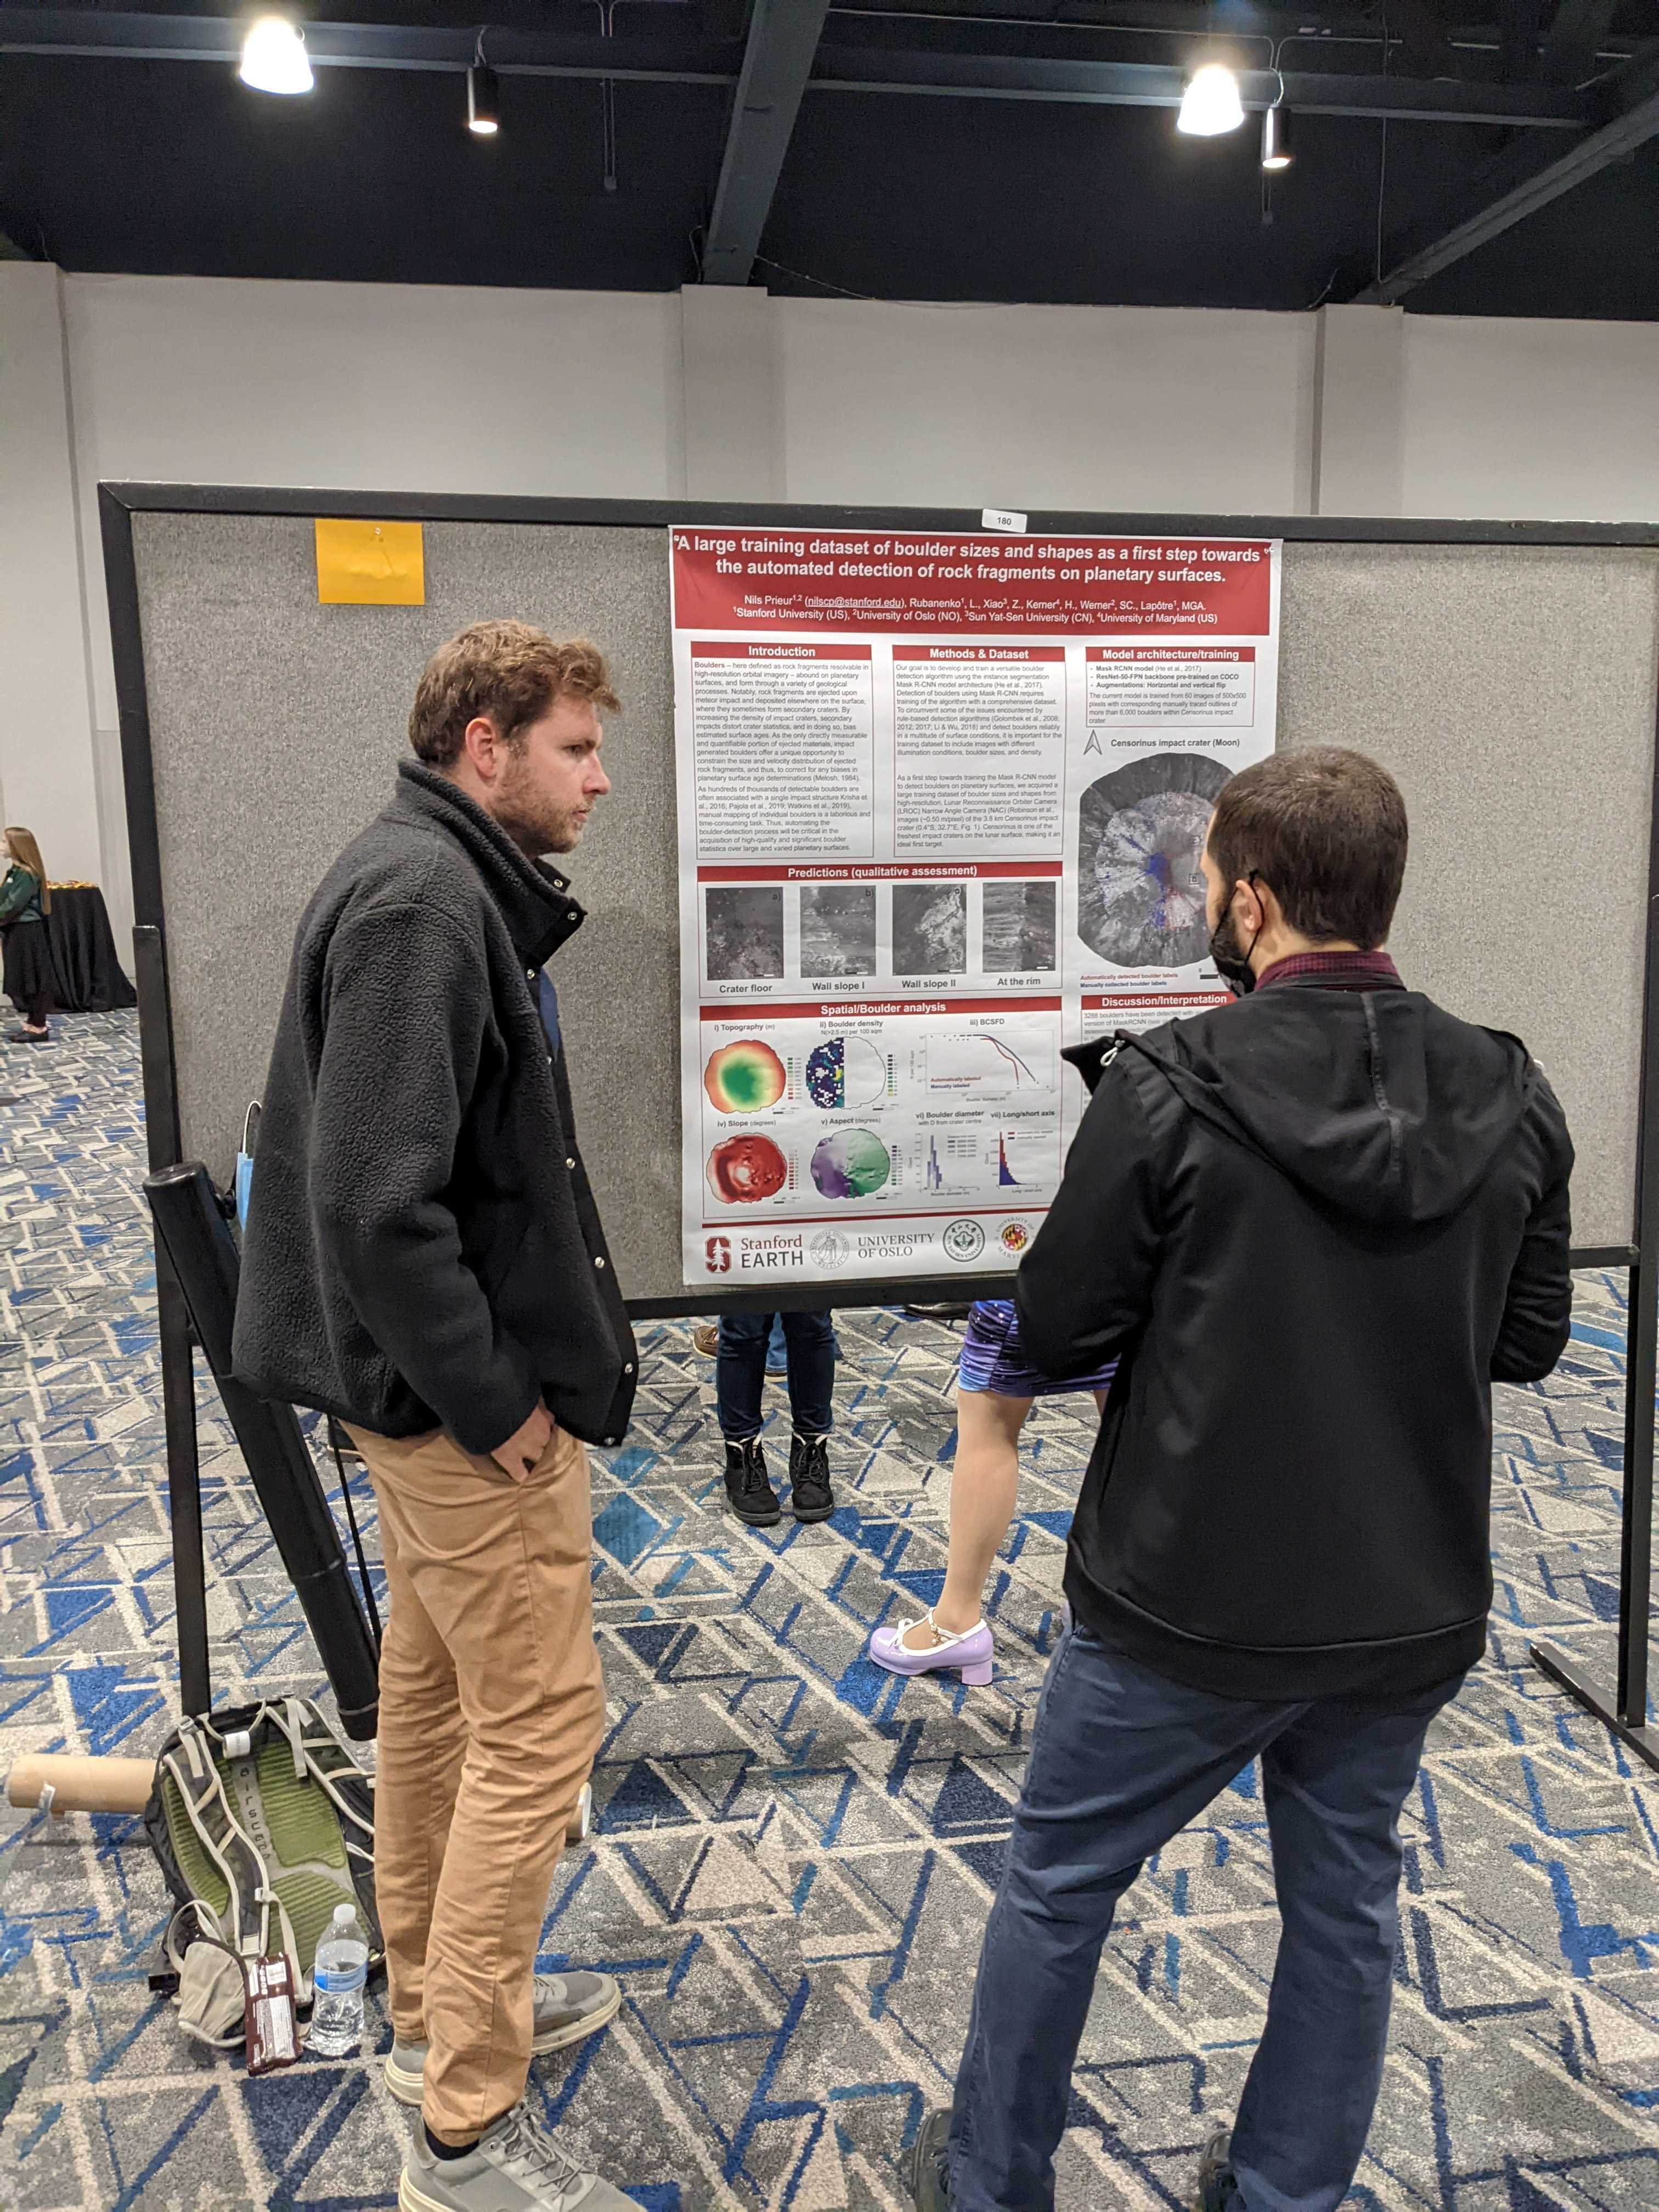 Caption: Presenting my preliminary results with a poster. Lot of people stopped by and were interested. Niceuru :)
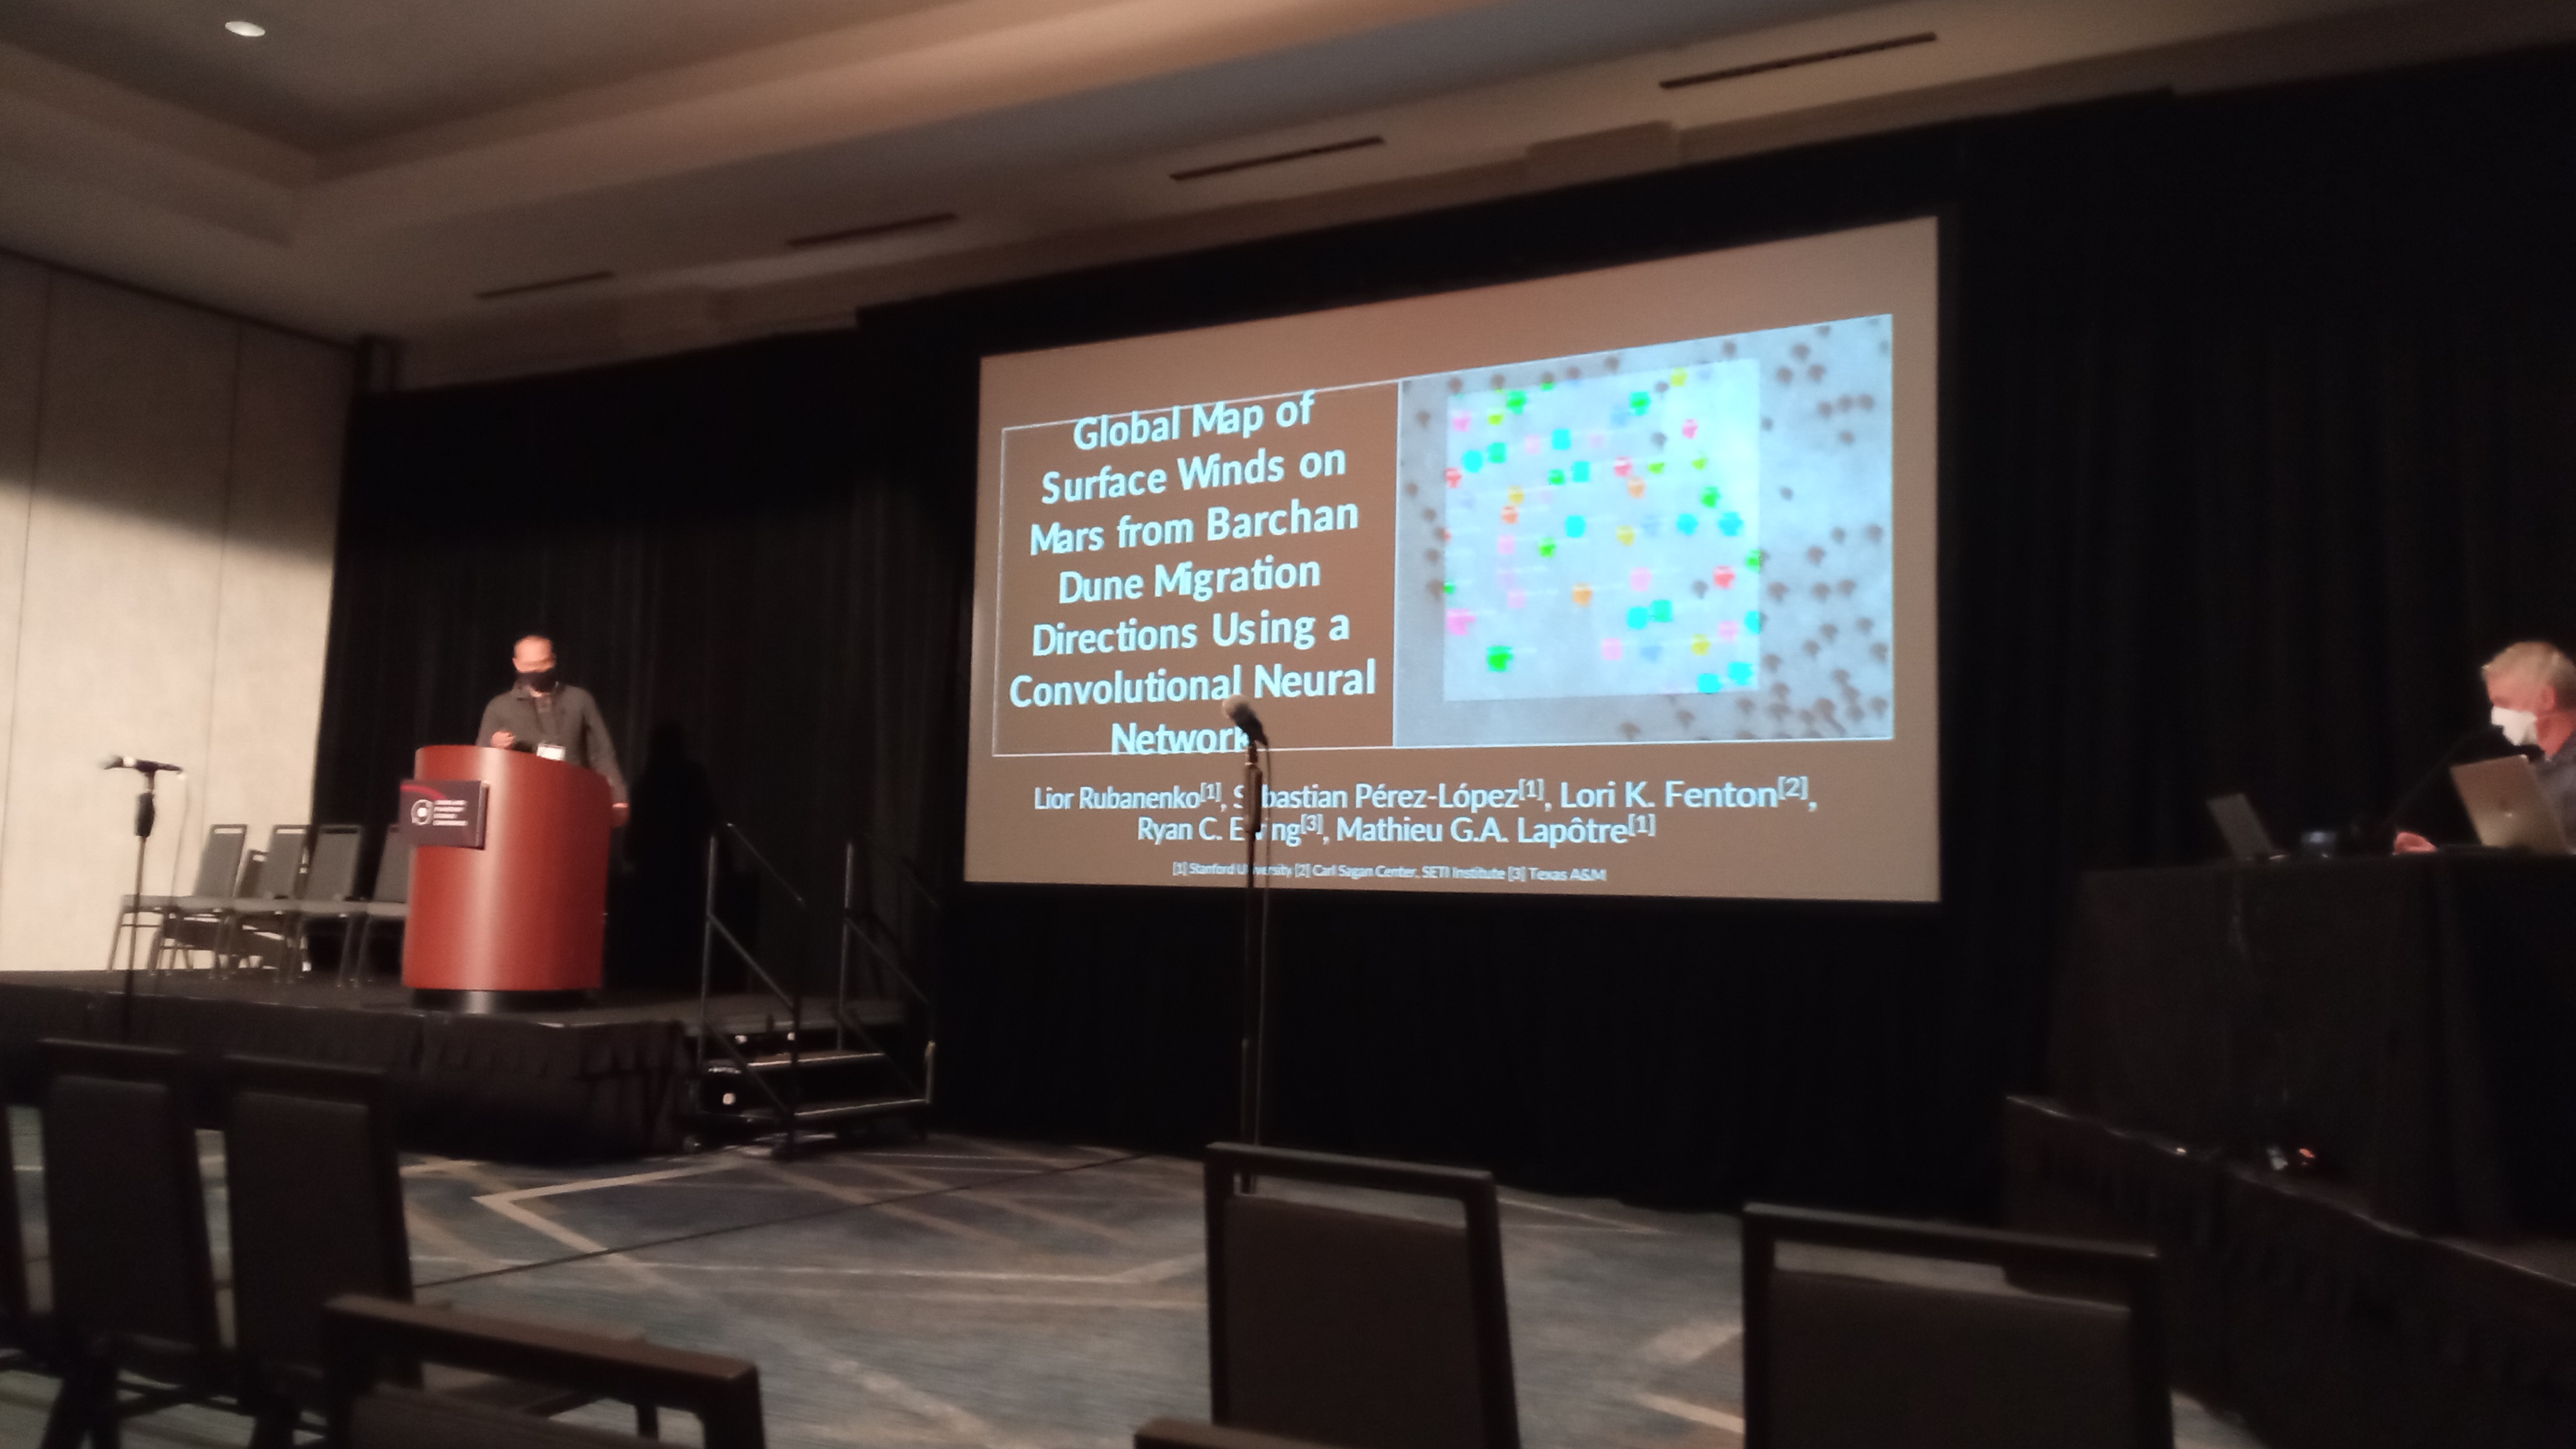 Caption: Picture of Lior’s presentation (who is another postdoc in the group). He is working on a similar topic, but focusing on deep-learning for the detection of dunes on Mars.
Published:
Hey folks! Before I jump into fieldwork, I need to get comfortable with my new drone. That means finding a spot for a test flight—easier said than done in the Bay Area! Drones are only allowed in uncontrolled airspace (Class G), and with major airports like SF and Oakland nearby, plus a bunch of smaller ones, Class G airspace is as rare as a unicorn.
I scouted the hills southwest of Stanford, hoping for a quiet field. But between protected wildlife areas and private properties wrapped in barbed wire, my luck ran out. After a few car trips and a lot of Googling, I stumbled upon Baylands Park. Although it’s not technically in Class G and sits suspiciously close to SF airport, it came highly recommended by the drone community. Fingers crossed, I decided to give it a go. And wow, what an experience! After setting up on a big grassy field, I got the drone ready. Drawing a flight path on the controller screen was surprisingly intuitive. Once everything was set, I hit the magic button, and the drone took off, flew its route, and landed all by itself. Super smooth! I just had to keep an eye on the battery, which drains faster than you’d think, and make sure the drone stayed within range.
Next up: processing the images. Drones capture a ton of data, and I used Metashape Pro, a fantastic tool available in Mathieu’s lab, to stitch the images together into an orthoimage. These geo-referenced images can be imported straight into GIS software like QGIS—an absolute game-changer for my workflow.
Fieldwork is right around the corner, but before that, I’ll present my preliminary results at the Lunar and Planetary Science Conference in March. It’ll be great to get some feedback and fine-tune my process. Until then, peace out and take care! 😊
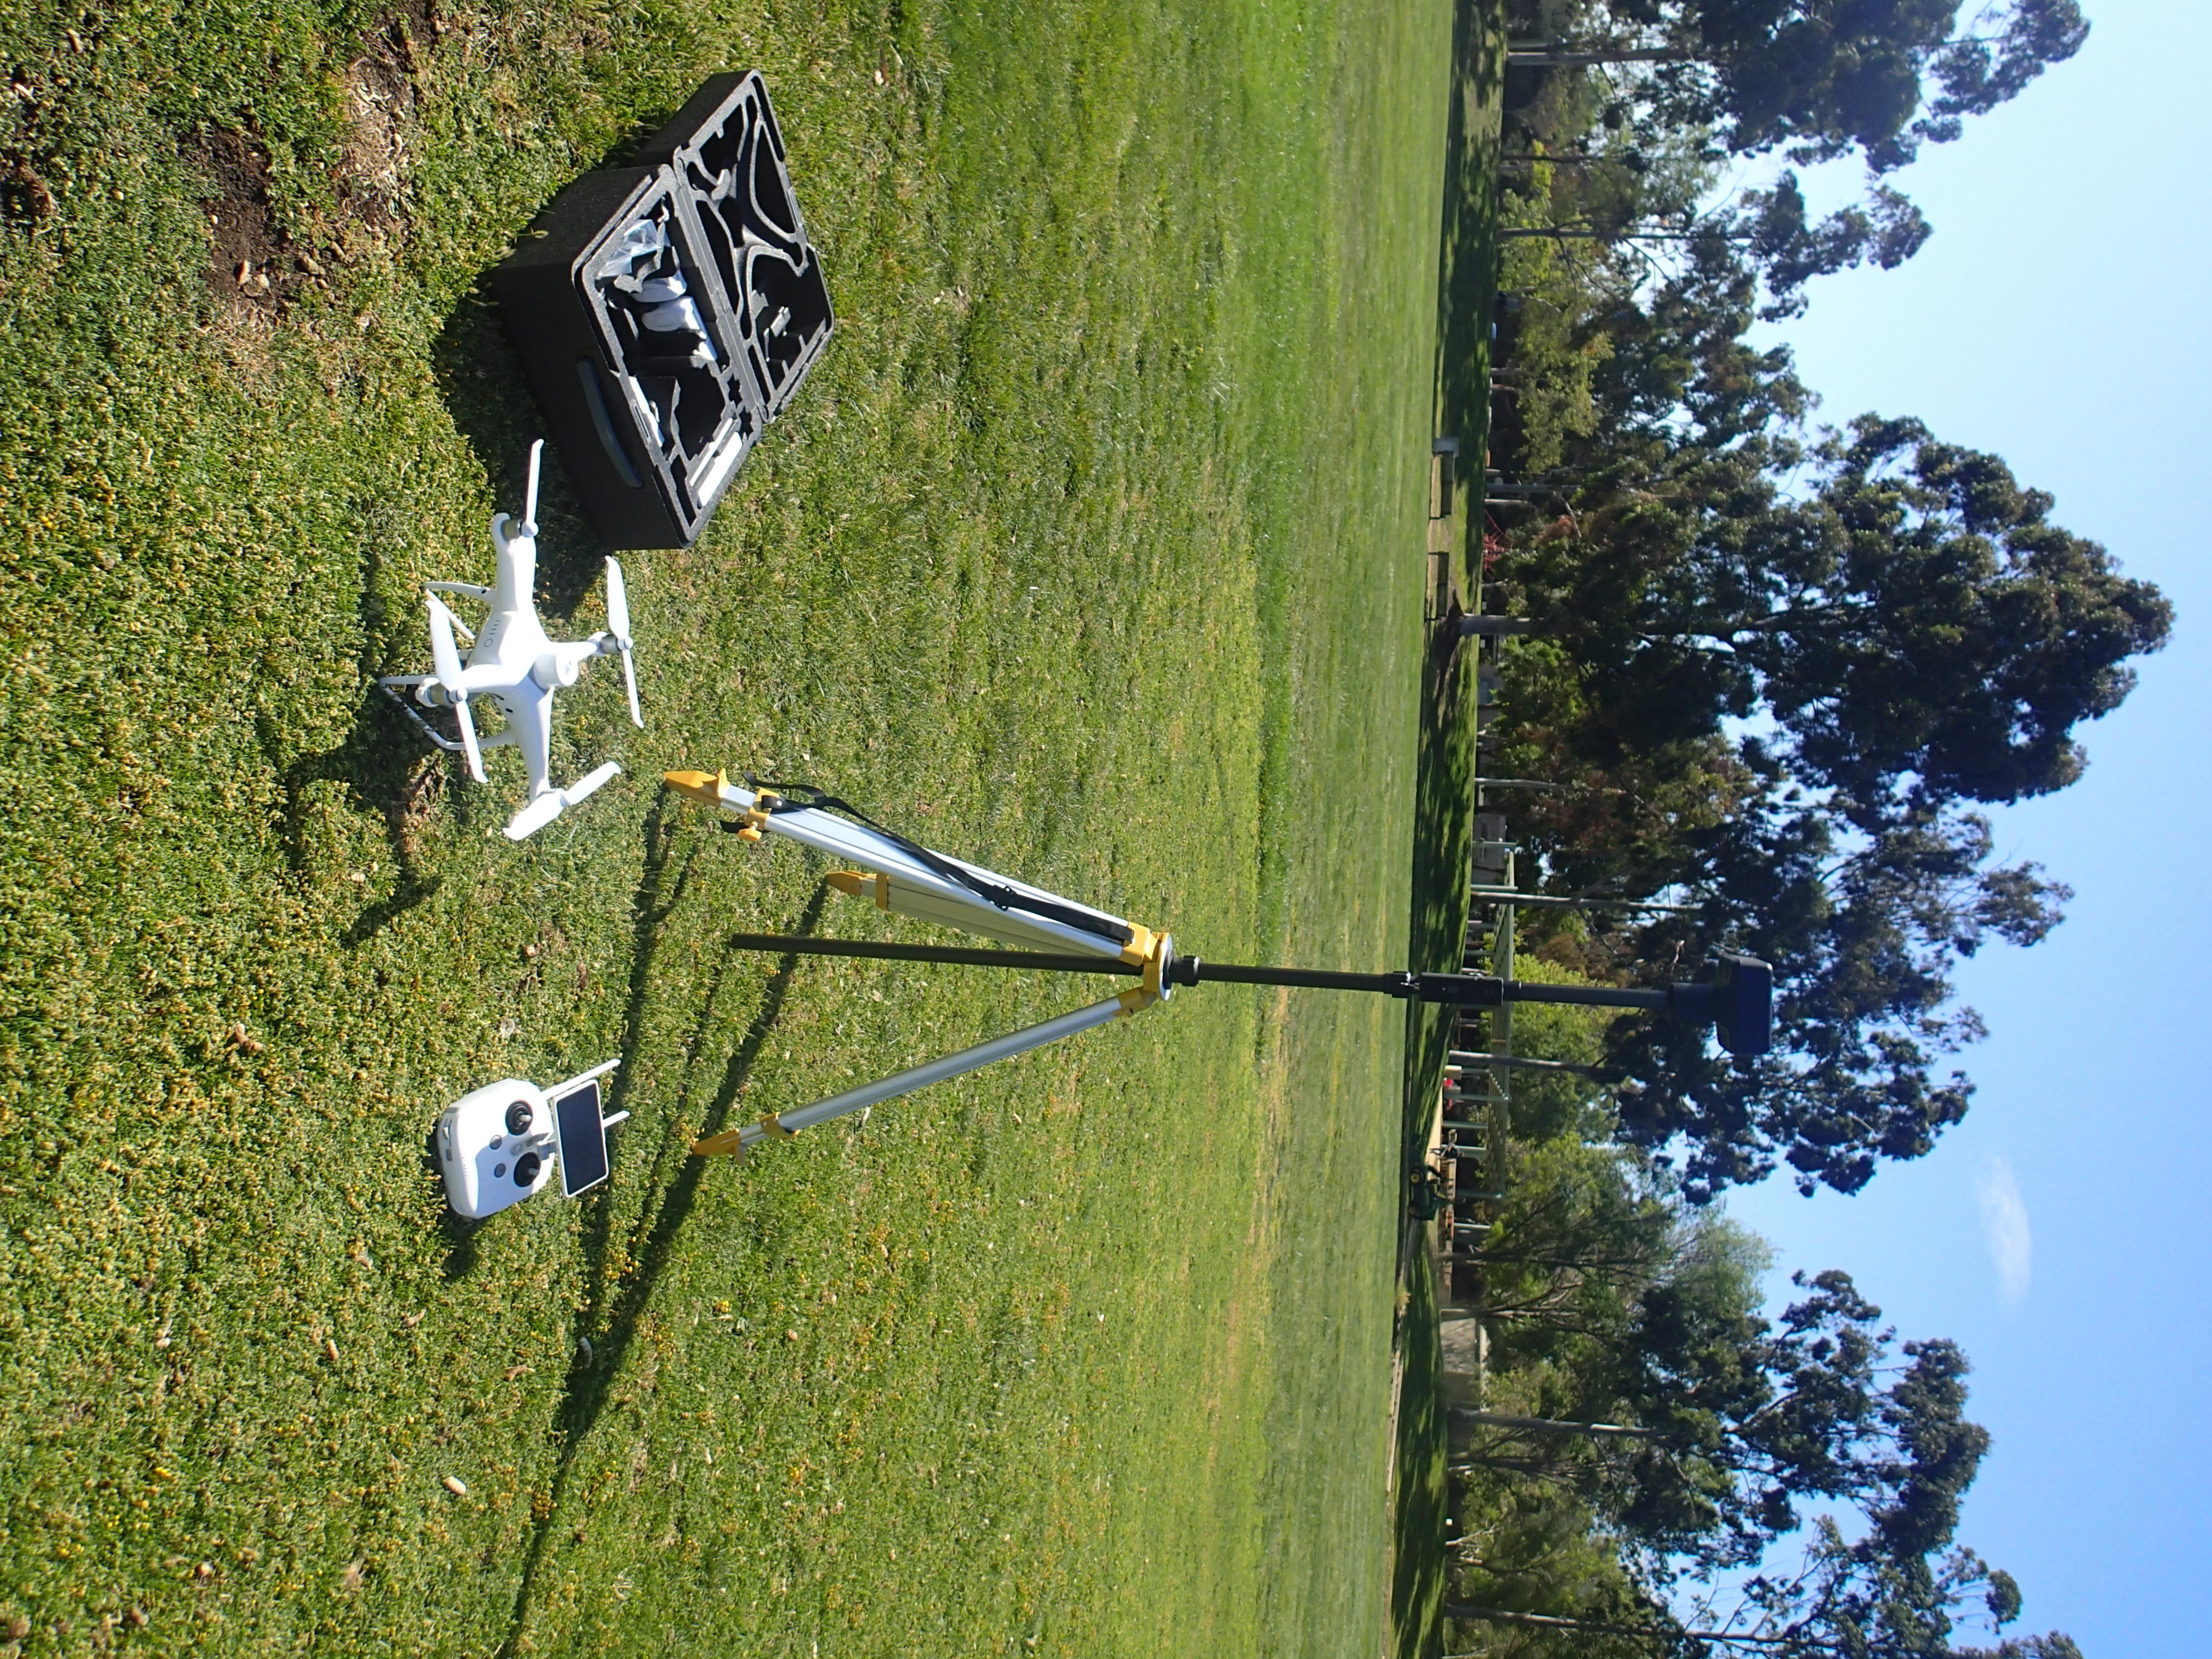 Caption: First time trying the drone in Baylands Park!
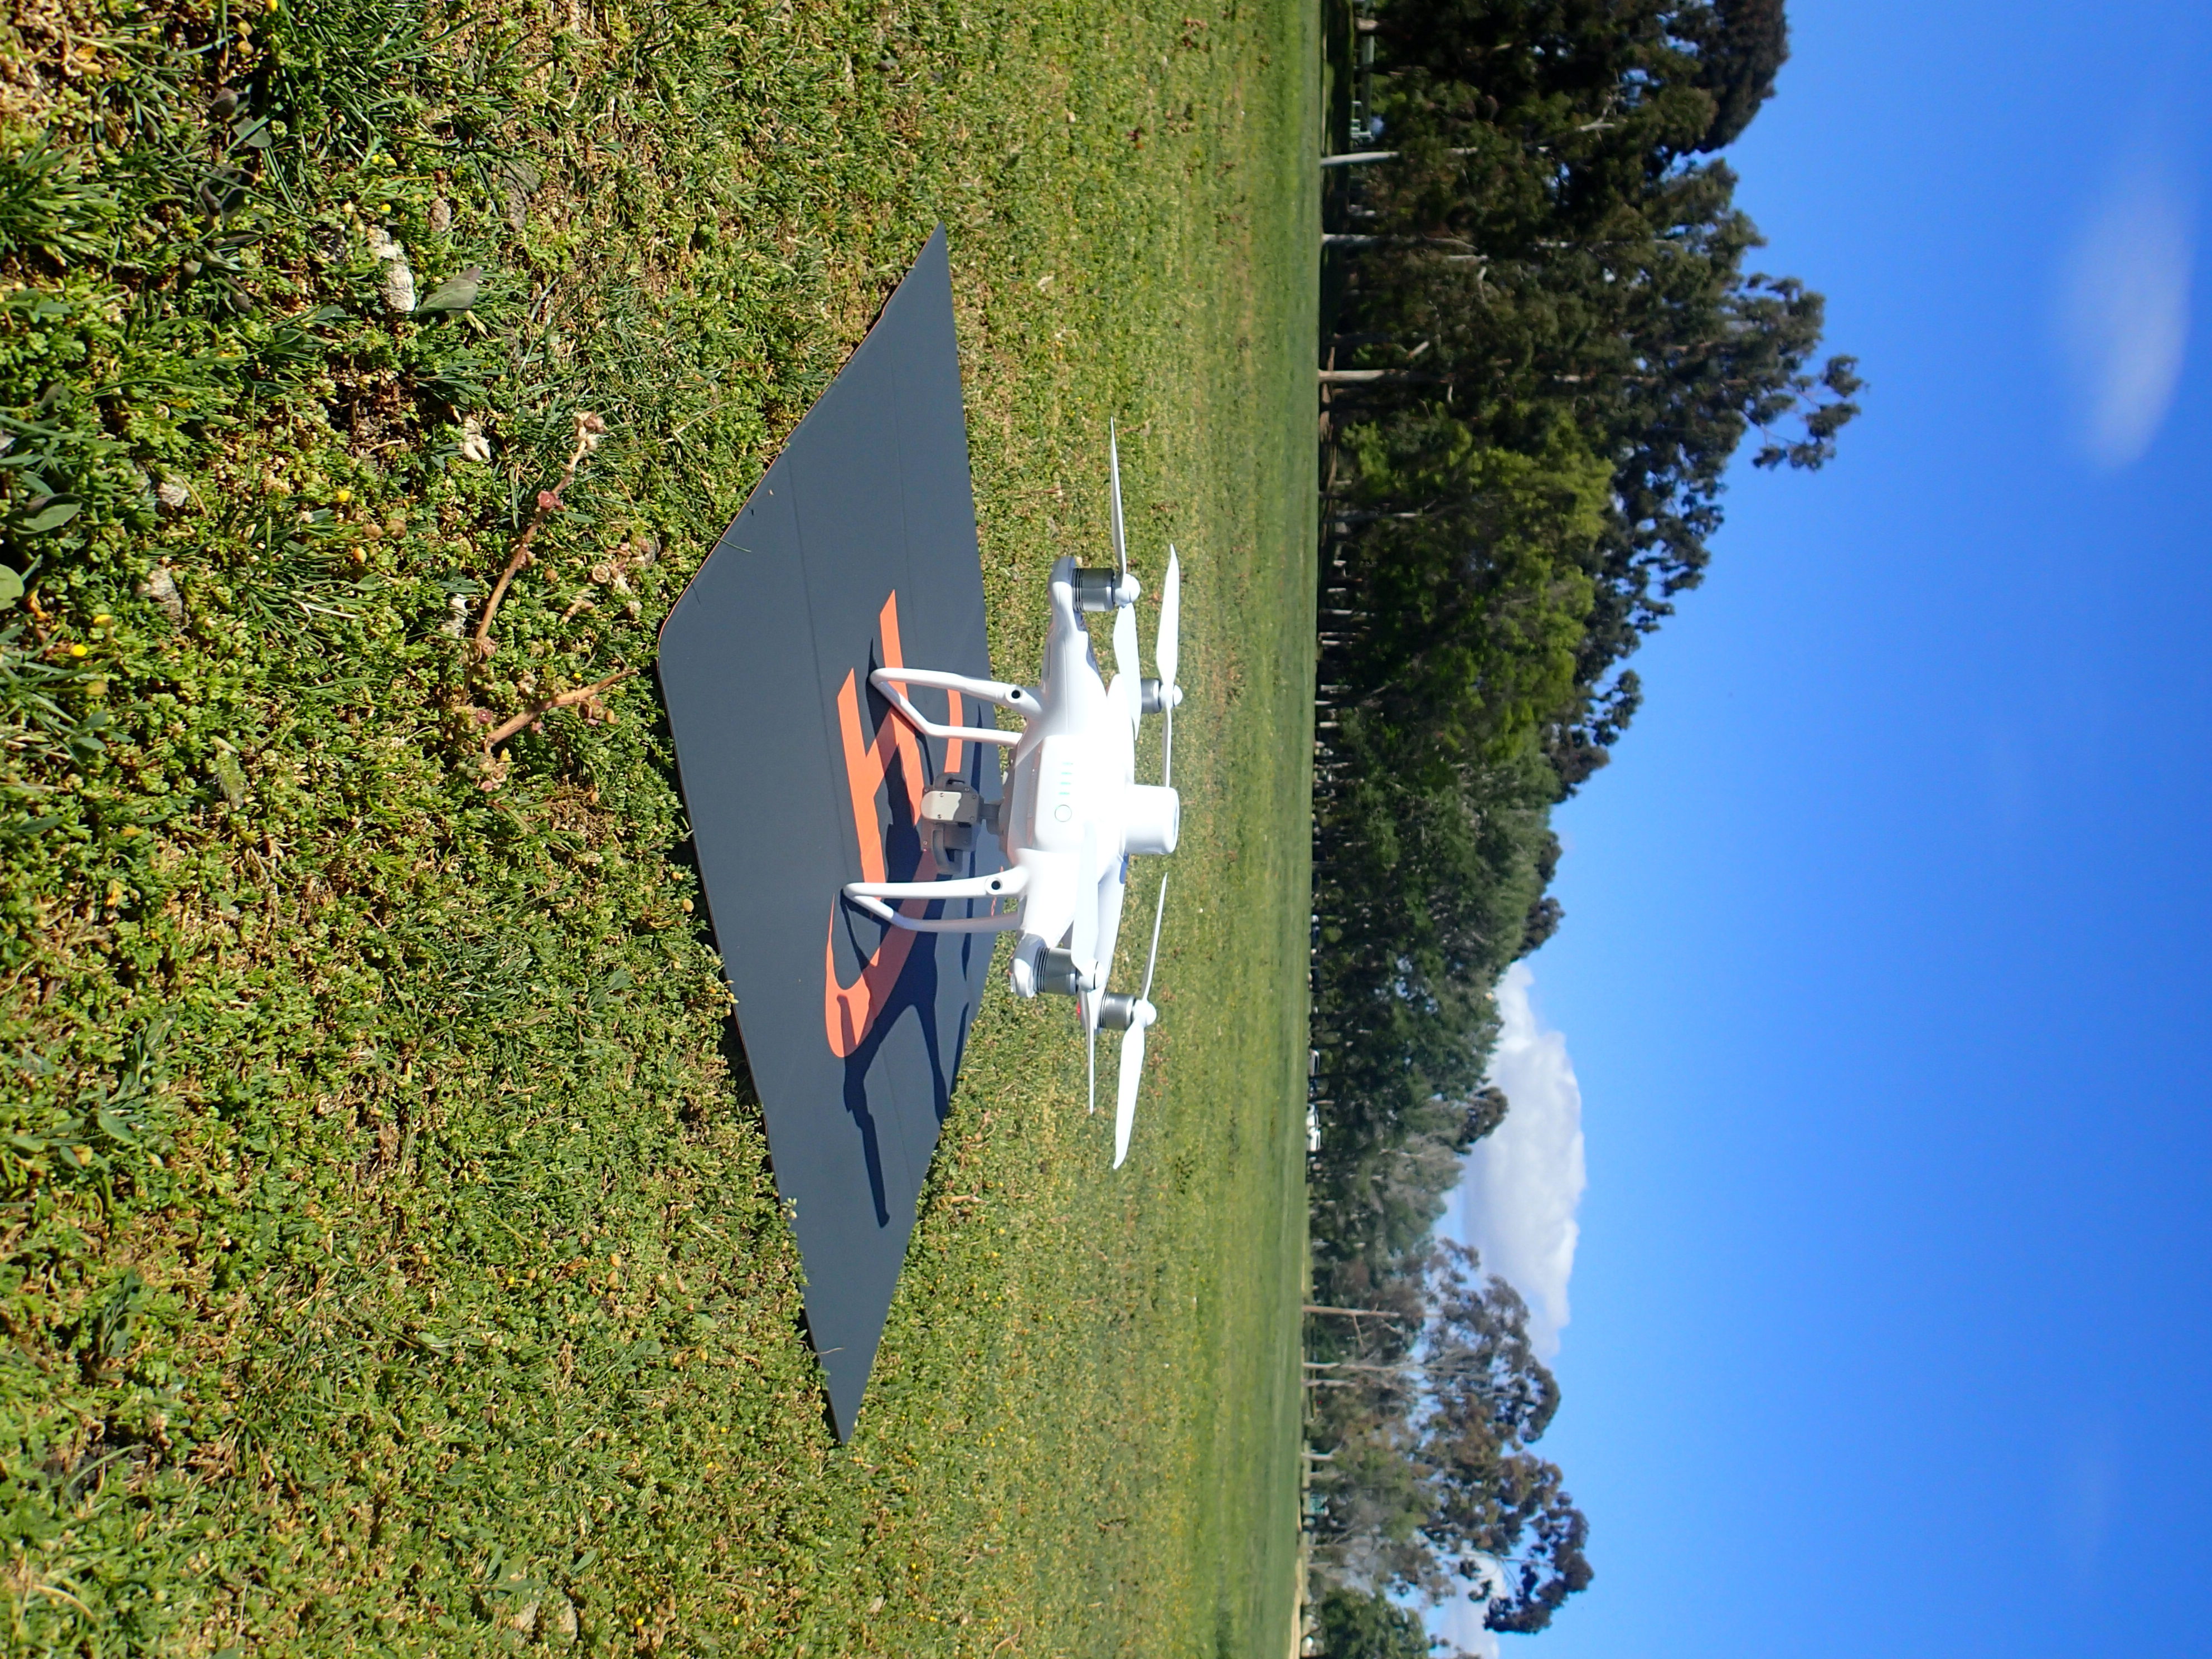 Caption: Just moment before the first test.
Published:
Hey everyone! Today’s entry is a bit more personal. Living far from home isn’t a walk in the park. My wife, Siri, is also a researcher, currently doing her postdoc at Ås University near Oslo. As much as we’d love to live together, her work keeps her in Norway, though she visits me every 3–4 months. She’s even considering applying for funding to establish a collaboration with a group here at Stanford—fingers crossed for early 2023!
Life is so much better when she’s here. But when she leaves, the apartment feels eerily quiet. You really notice how much someone’s presence shapes your day-to-day life. On the flip side, I think this time apart has made our relationship stronger. The 9-hour time difference is a beast, though! She’s winding down her day as mine kicks off, which makes syncing up for a chat tricky. But we make it work.
Luckily, life at Stanford has been great. The university does a lot to make postdocs feel welcome. I’ve met some awesome people, especially through the tennis postdoc group. Now, don’t get me wrong—I’m terrible at tennis! But the real fun starts afterward, when we grab beers and hang out on campus. Between that and meeting people in various intro classes, I’ve found a solid group of friends: Derrick, Laura, Robbie, Jose, and my buddy in San Francisco, Andrasz.
When Siri’s not around, I pour my energy into the project and make the most of the vibrant social life here. It’s all about finding that balance between work and keeping morale high. Till next time—take care!
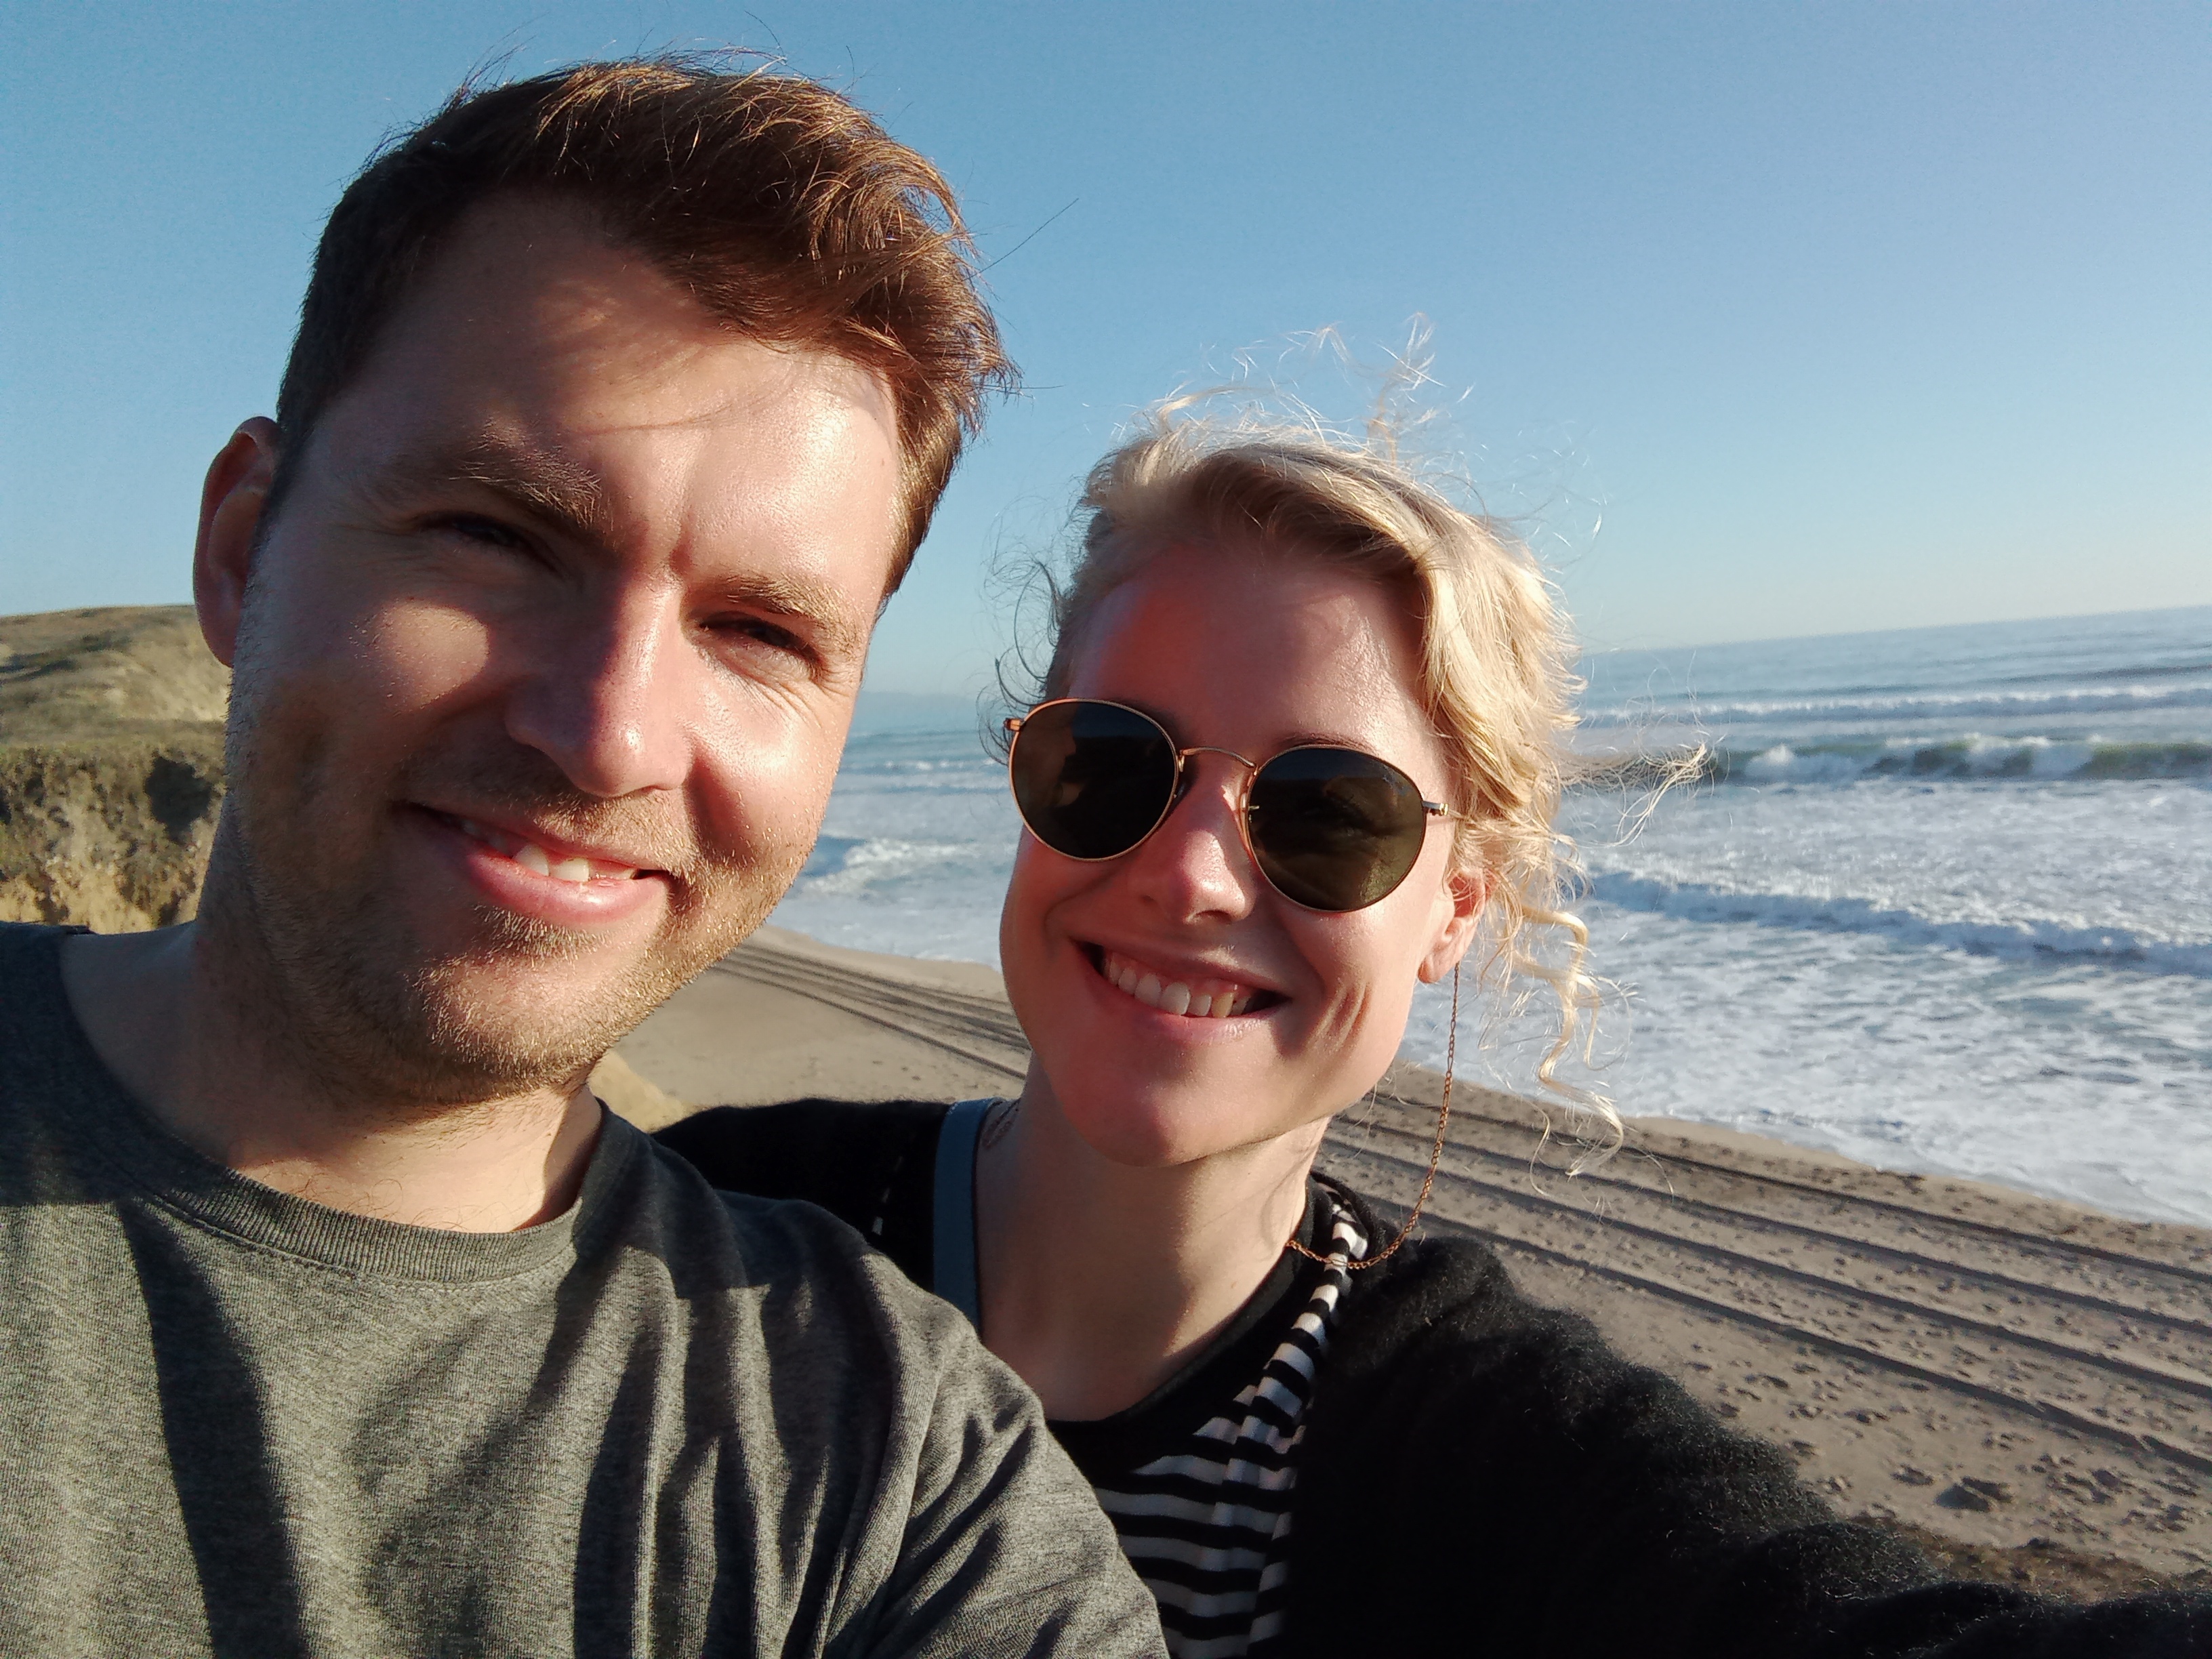 Caption: Missing my wife <3!
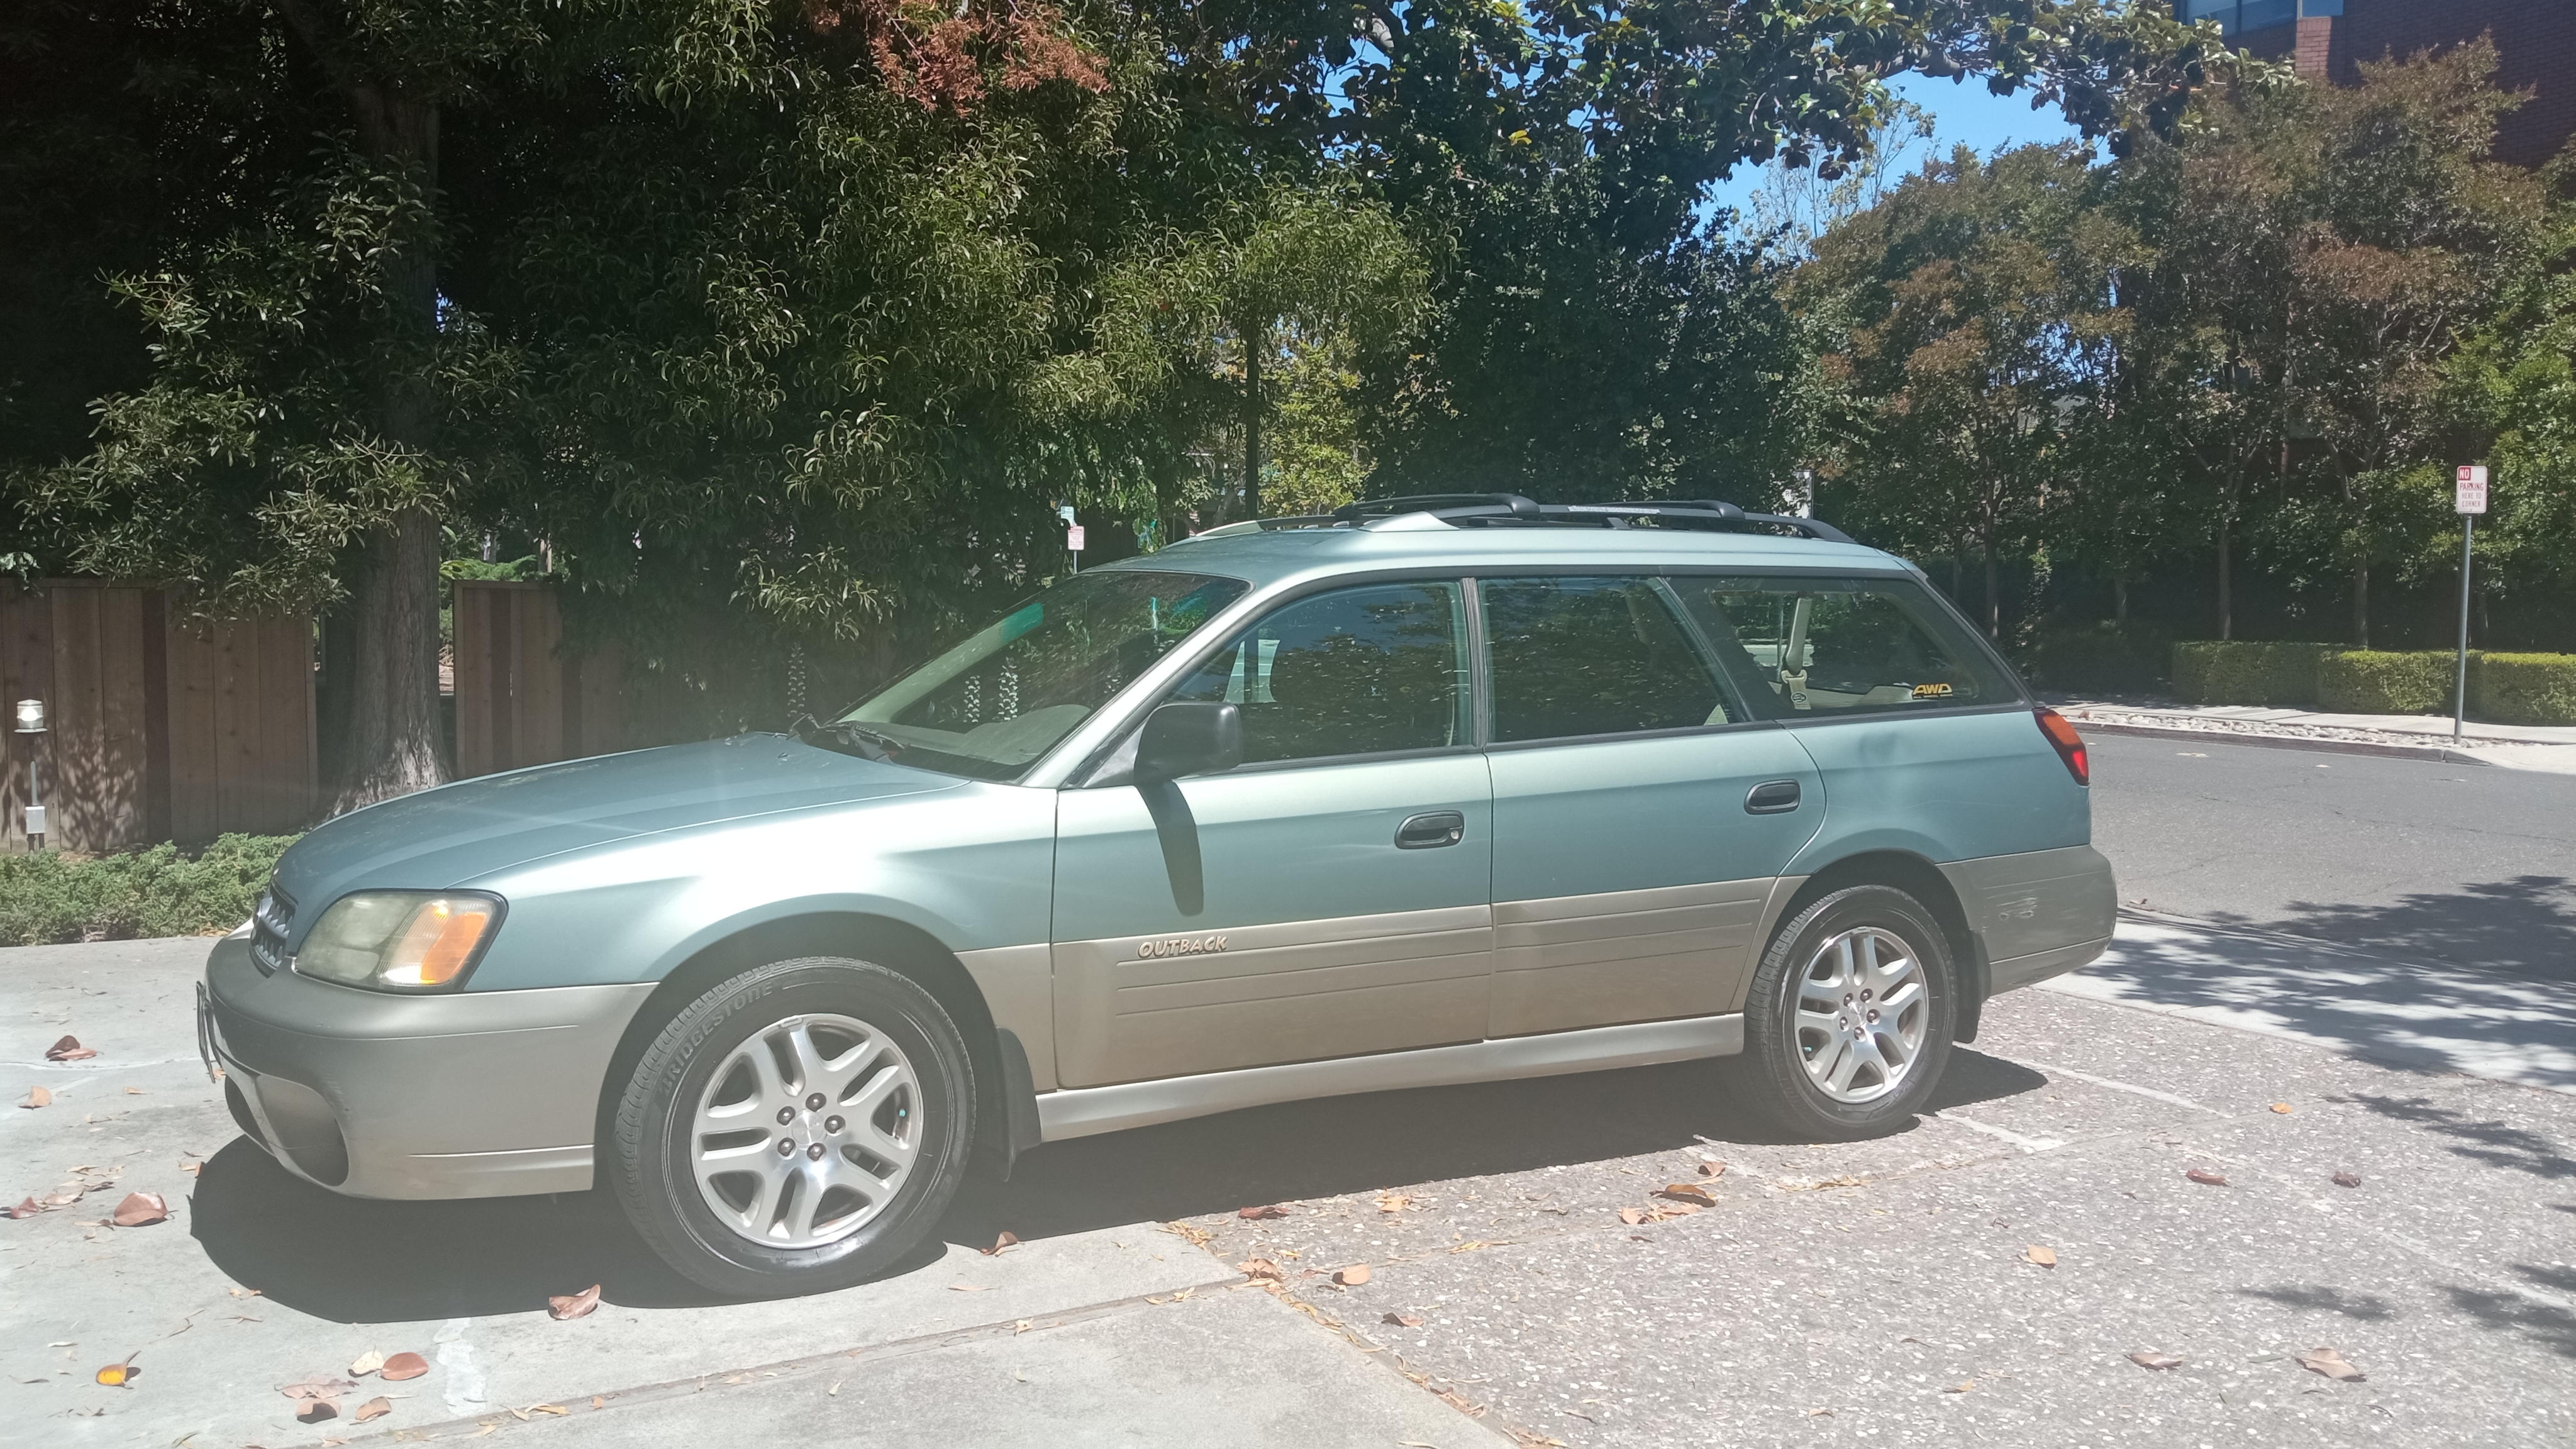 Caption: I used the time to alone to get my driving license in the US, and I bought a old subaru from a colleague that will go back to Australia.
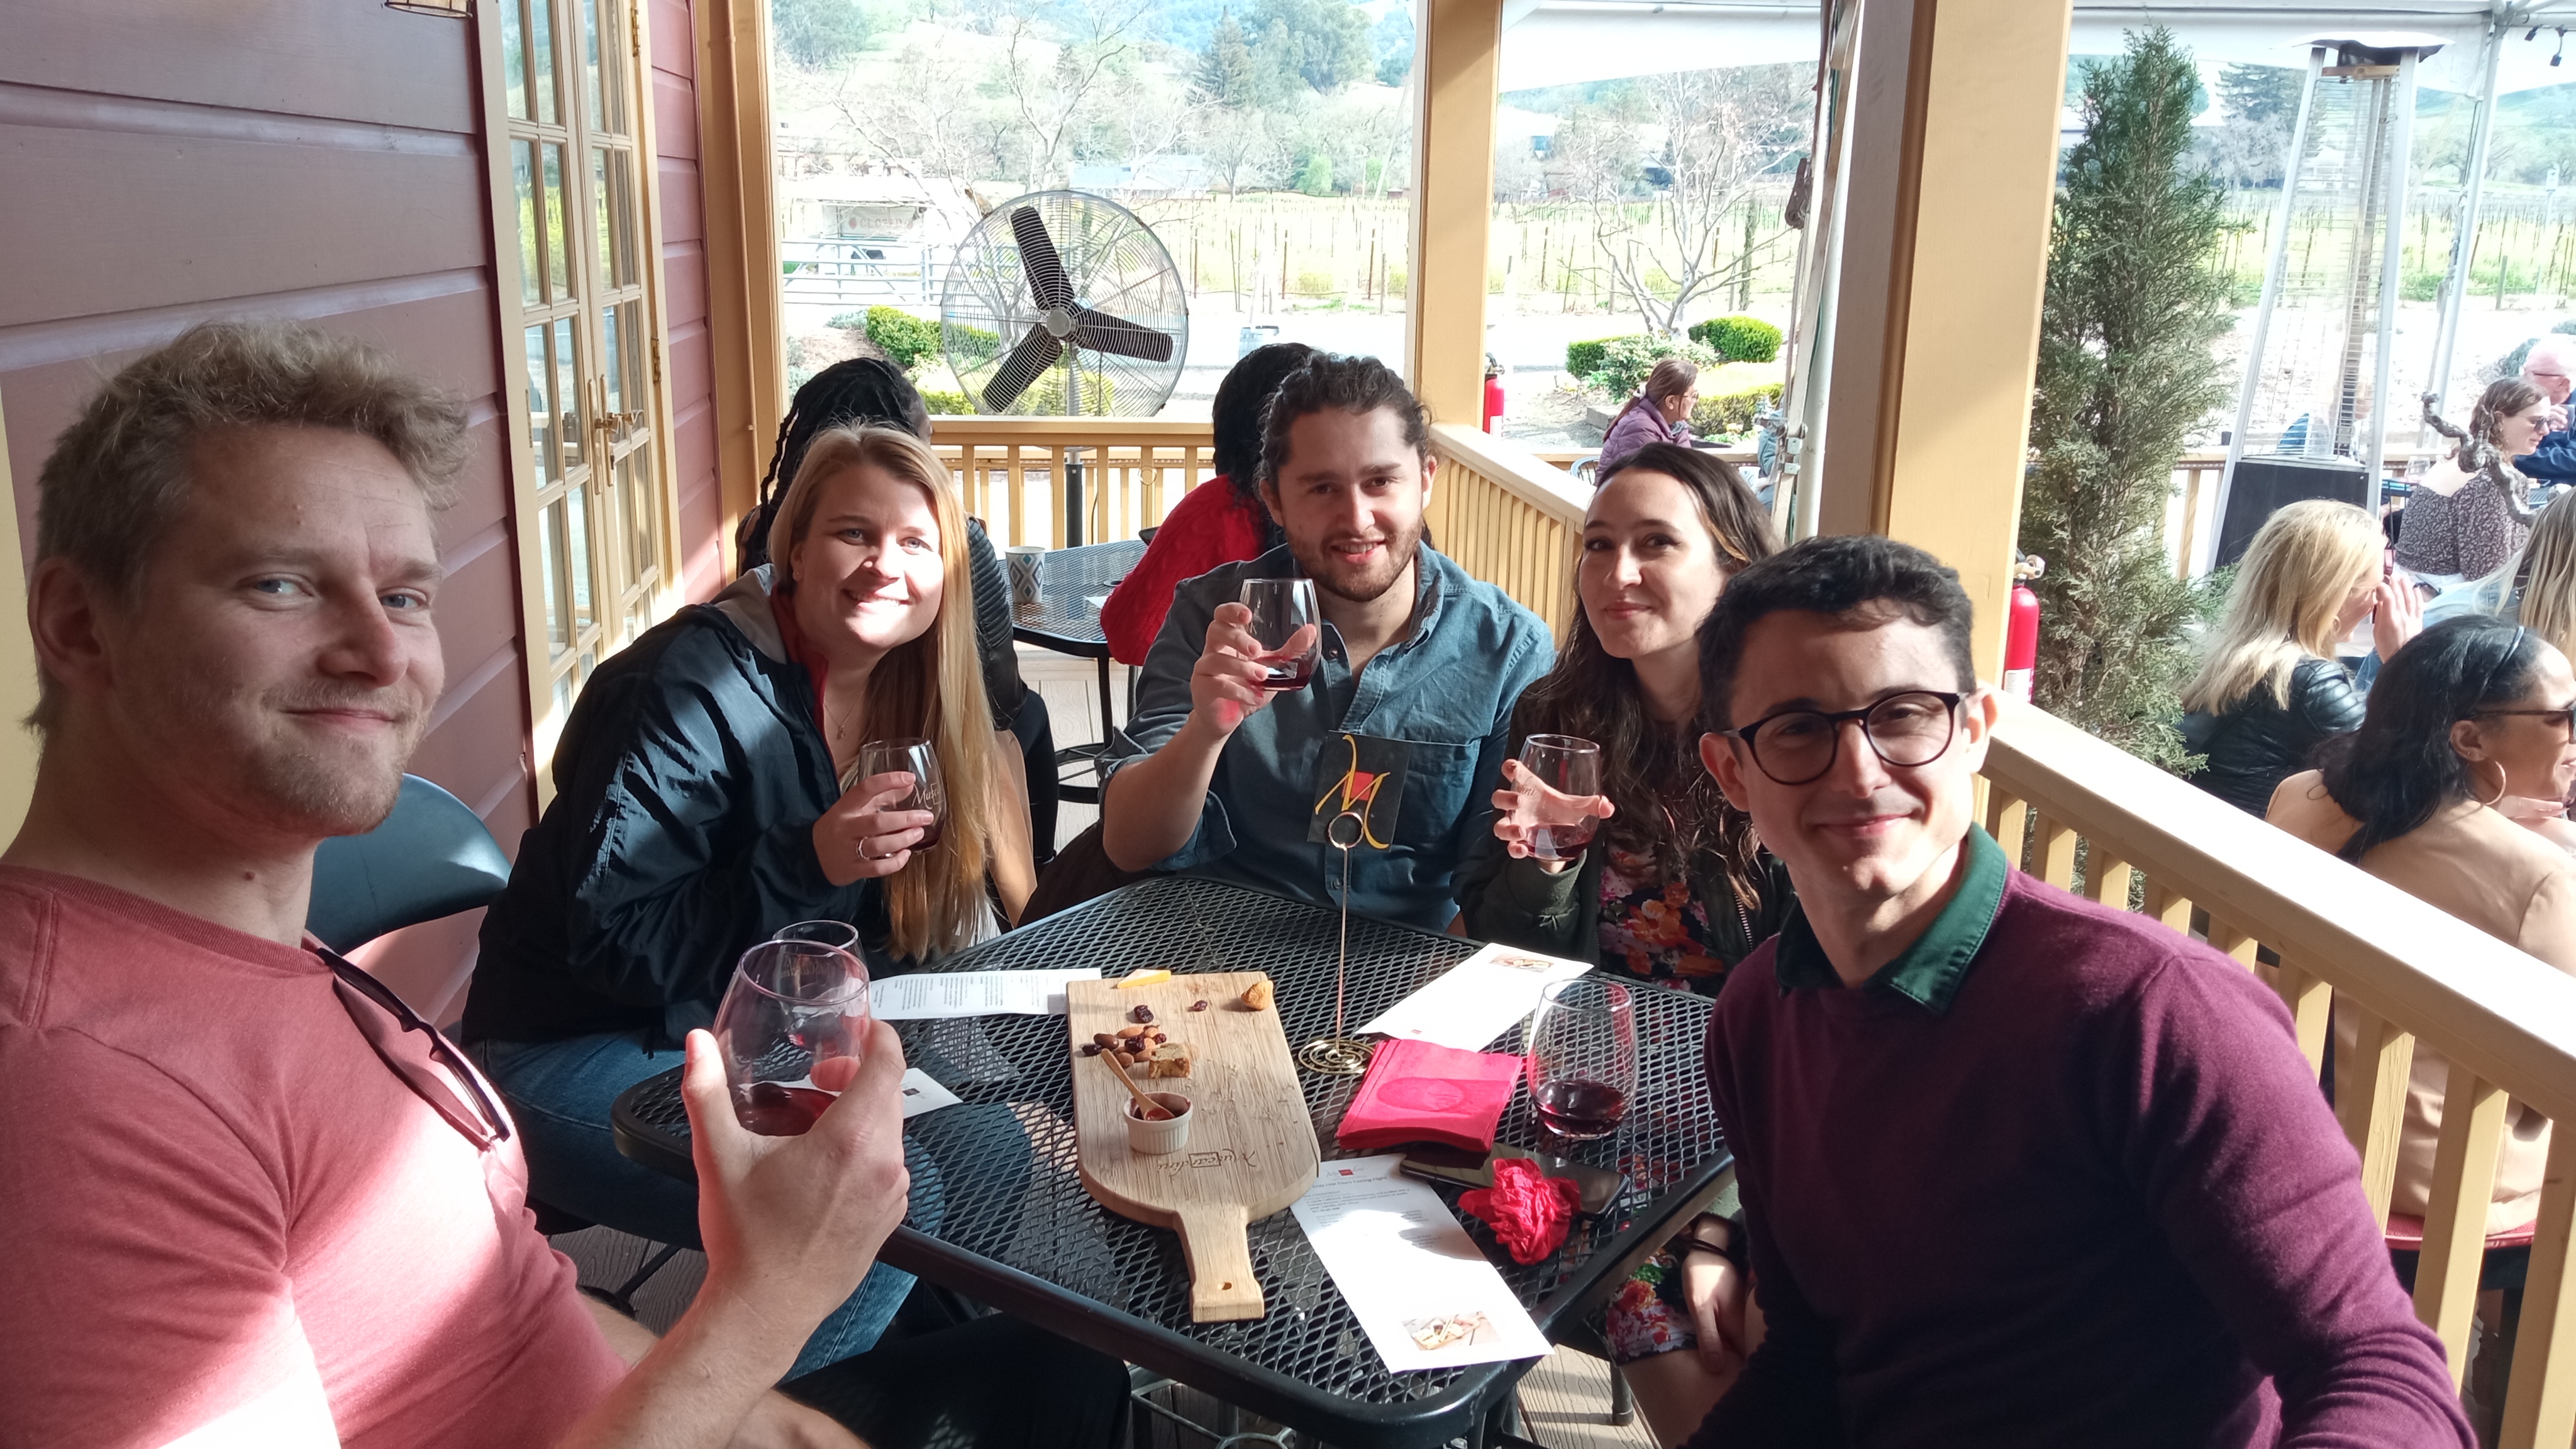 Caption: Wine tasting in Sonoma with a few other Stanford postdocs.
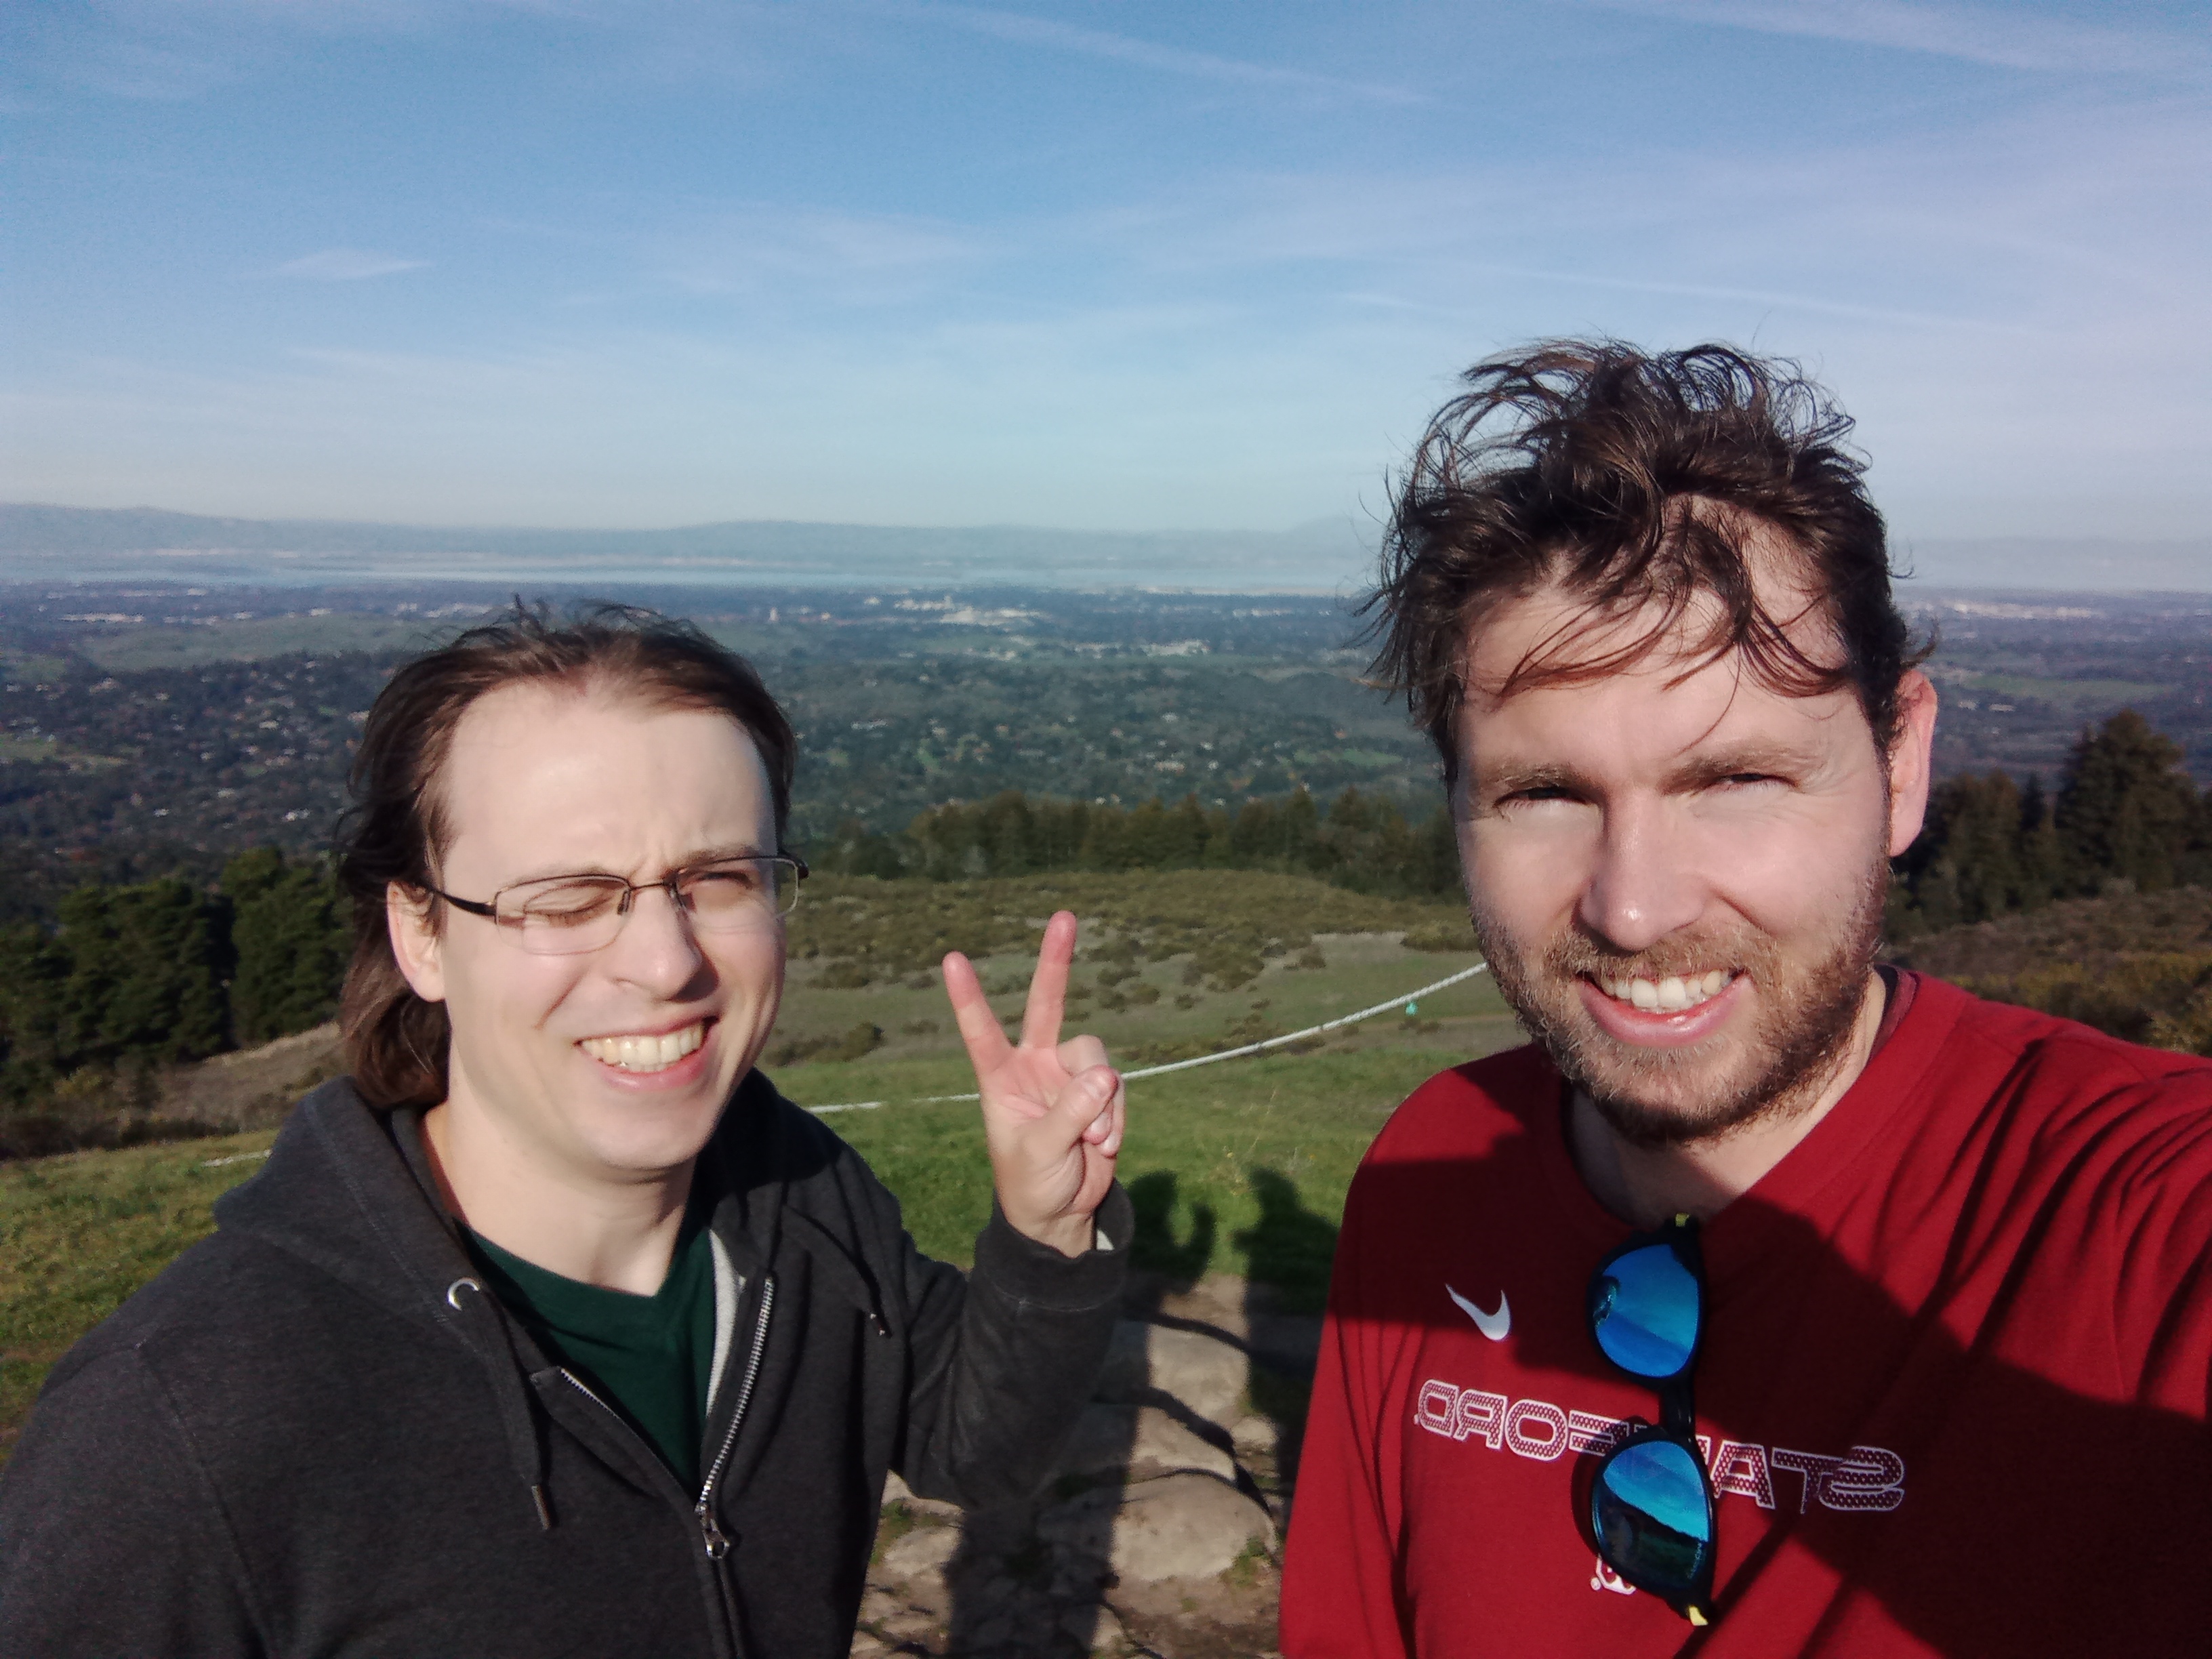 Caption: Hiking in the hills behind Stanford with Andrasz. My good Hungarian/US friend that lives in SF.
Published:
Hey folks! While I’m still waiting for the fieldwork season to kick off next year, I’ve been keeping busy with some lunar data. My current focus is mapping boulders around young impact craters on the Moon—by “young,” I mean geologically speaking, anywhere from a few million to a couple of hundred million years old. Since the Moon lacks an atmosphere and active geology, erosion is quite slow, preserving impact craters for much longer periods than on Earth.
I’ve chosen the Censorinus impact crater as my first mapping site. Censorinus is a relatively small, 3.8-kilometer-wide crater on the lunar highlands. Its bright ejecta blanket and well-preserved rays make it an ideal candidate for studying ejecta boulder distributions. The crater was even featured in a 2016 study by Krishna and colleagues, who documented over 240,000 boulders around it. Fun fact: Censorinus formed from an oblique impact, meaning the asteroid hit at a low angle, which creates an asymmetric ejecta pattern—a perfect case for my research.
I’m hoping to collaborate with the authors of that study, as it would be great to compare my mapping to theirs. In machine learning, it’s crucial to understand the variability in how different humans label data. This will help me refine my guidelines for annotating boulder outlines, ensuring consistent results across the project.
Speaking of annotation, there’s a lot to consider. Should I include shadows in the boulder outlines? How do I handle boulders near the resolution limit of the Lunar Reconnaissance Orbiter’s Narrow-Angle Camera (NAC) images? These high-res images are enormous, often over 70,000x10,000 pixels, and need to be broken down into smaller tiles for processing. I’ll need to establish best practices not just for myself but also for any students who might assist in the future.
Lastly, I’m beginning to train my boulder detection algorithm using Detectron2. It’s a cutting-edge platform for object detection, but adapting it to lunar data is a challenge. With so many rocks on the Moon, the algorithm needs a large and well-labeled dataset to perform accurately. Plenty of work ahead!
That’s all for now. Time to wrap up and get ready for a cozy Christmas back home in Norway. Take care, and happy holidays! 🎄
Published:
Hey folks! Big news: I’m officially a licensed drone operator in the U.S. 🎉 On December 9th, 2021, I took the FAA’s Unmanned Aircraft General (UAG) exam, and wow, it was no joke. It felt like cramming for an airline pilot’s test! The 100+ pages of dense regulations, airspace classifications, and emergency procedures were quite the mountain to climb. And, after a grueling 150 minutes, I passed—just barely, with the minimum 70%! Talk about a nail-biter.
Let me give you a quick rundown of what I had to learn (or should I say survive):
Airspace classification: Memorizing which airspace you can fly in without causing a national incident. Weather interpretation: Deciphering aviation weather reports like I was cracking the Enigma code. Physiological factors: Keeping myself fit and hydrated (coffee addiction not helping!). I can now say I have a newfound respect for the skies—and a drone pilot is practically a co-pilot! Now, for the less exciting part: I had planned to do fieldwork in Death Valley’s Mars Hill, a prime Mars analog location. Unfortunately, despite my polite emails and promises of eco-friendly, non-invasive drone use, the National Park Authority said no. Apparently, aerial research there must be conducted with planes. Yes, planes! If only I had a Cessna in my back pocket. I’m now scouting other field sites in the Sierra Nevada, which should still offer excellent boulder fields for my project. Stay tuned for more adventures in drone regulations!
On a brighter note, I’ve purchased the Phantom 4 RTK drone, an absolute beast for precision mapping. With programmable flight paths and altitude control, it’s perfect for capturing consistent images under varying light conditions. I’m itching to test it and see those crisp boulder shots.
That’s all for now! Fieldwork planning continues, and I’m ready to take to the skies (responsibly, of course). Until next time, take care and keep reaching for new heights!
Published:
Hey everyone! After a month of running around like a headless chicken—attending mandatory classes, filling out forms, and finally setting up my office—I can officially say that I’m ready to dive into the science. It feels great to shift gears from logistics to research!
First on the agenda: getting my hands dirty with some boulder digitization. I’ll be outlining boulders in specific areas of the lunar surface, which sounds simple enough but is actually crucial for analyzing impact processes. This work lays the groundwork for understanding how ejected materials behave and disperse across planetary surfaces.
Next up, fieldwork prep! To gather data for the terrestrial side of the project, I’ll be heading out to the Sierra Nevadas, Mojave Desert, and Death Valley. But before I can do that, there’s one little hiccup—I need to buy a drone and get a pilot’s license. The FAA takes drones very seriously, and their regulations are no joke. Thankfully, I’ve got a few months before the field season kicks off since these areas are often covered in snow during the winter. Fingers crossed for smooth skies!
Finally, the real meat of the project: diving into deep learning. I’ll be working with Detectron2, a super powerful tool for object detection and segmentation, to automate boulder detection on planetary surfaces. However, it uses an object-oriented approach in Python, which isn’t exactly my comfort zone (functional programming gang, where you at?). So, there’s a bit of a learning curve ahead, but hey, challenges make it fun, right?
That’s it for now. Back to coding and FAA study guides. Cheerios! 😊
Published:
Craters are among the most common features on solid planetary surfaces—planets, moons, and even asteroids. When an impact occurs, rock fragments are ejected from the crater cavity and scattered across the surface, sometimes forming secondary craters in the process. The most enduring evidence of these ejections? Boulders.
Boulders hold the key to understanding ejection mechanisms. Their size, shape, and the terrain where they settle provide clues about the forces involved and the processes that shaped them. By studying these rocky remnants, we can learn a lot about the impact events that formed them, as well as how these events have shaped planetary surfaces over time.
That’s where the BOULDERING project, funded by the Marie Skłodowska-Curie Actions programme, comes in. Using high-resolution imaging and deep learning, this project aims to investigate boulder populations in greater detail than ever before. By analyzing their size and shape distributions, we hope to uncover patterns that reveal the dynamics of ejection processes and the evolution of planetary surfaces.
The results won’t just help us understand craters on the Moon, Mars, or asteroids—they could also offer broader insights into the history of the Solar System. Stay tuned for more as the project unfolds! 🌌
Published:
After an unforgettable first night in our new apartment—sleeping on the ground because IKEA couldn’t deliver our mattress on time, and discovering that the airbed we’d bought from Target had a massive hole (thanks, Target!)—things quickly improved.
I had my first chance to meet my new colleagues at a barbecue event organized by Stanford’s Department of Geosciences. For the next two years, I’ll be part of the Earth and Planetary Surface Processes Lab (EPSP), led by Associate Professor Mathieu Lapotre. It’s an exciting group, including two other postdocs (Lior Rubanenko and Andrew Gunn) and two PhD students (Michael Hasson and Colin Marvin). Everyone was so welcoming, and the barbecue turned out to be the perfect icebreaker.
The EPSP lab focuses on comparative planetology, which means studying processes we observe on Earth—like dunes or river systems—and applying that knowledge to understand similar features on other planetary surfaces. It’s such a cool interdisciplinary field. If you’re curious, you can find a better explanation (and some of their awesome work) on the lab’s website: EPSP Lab at Stanford.
Between finally moving into our apartment and meeting this amazing team, it feels like everything is starting to fall into place. Here’s to the next steps in this adventure! Cheers! 🍔 🌍
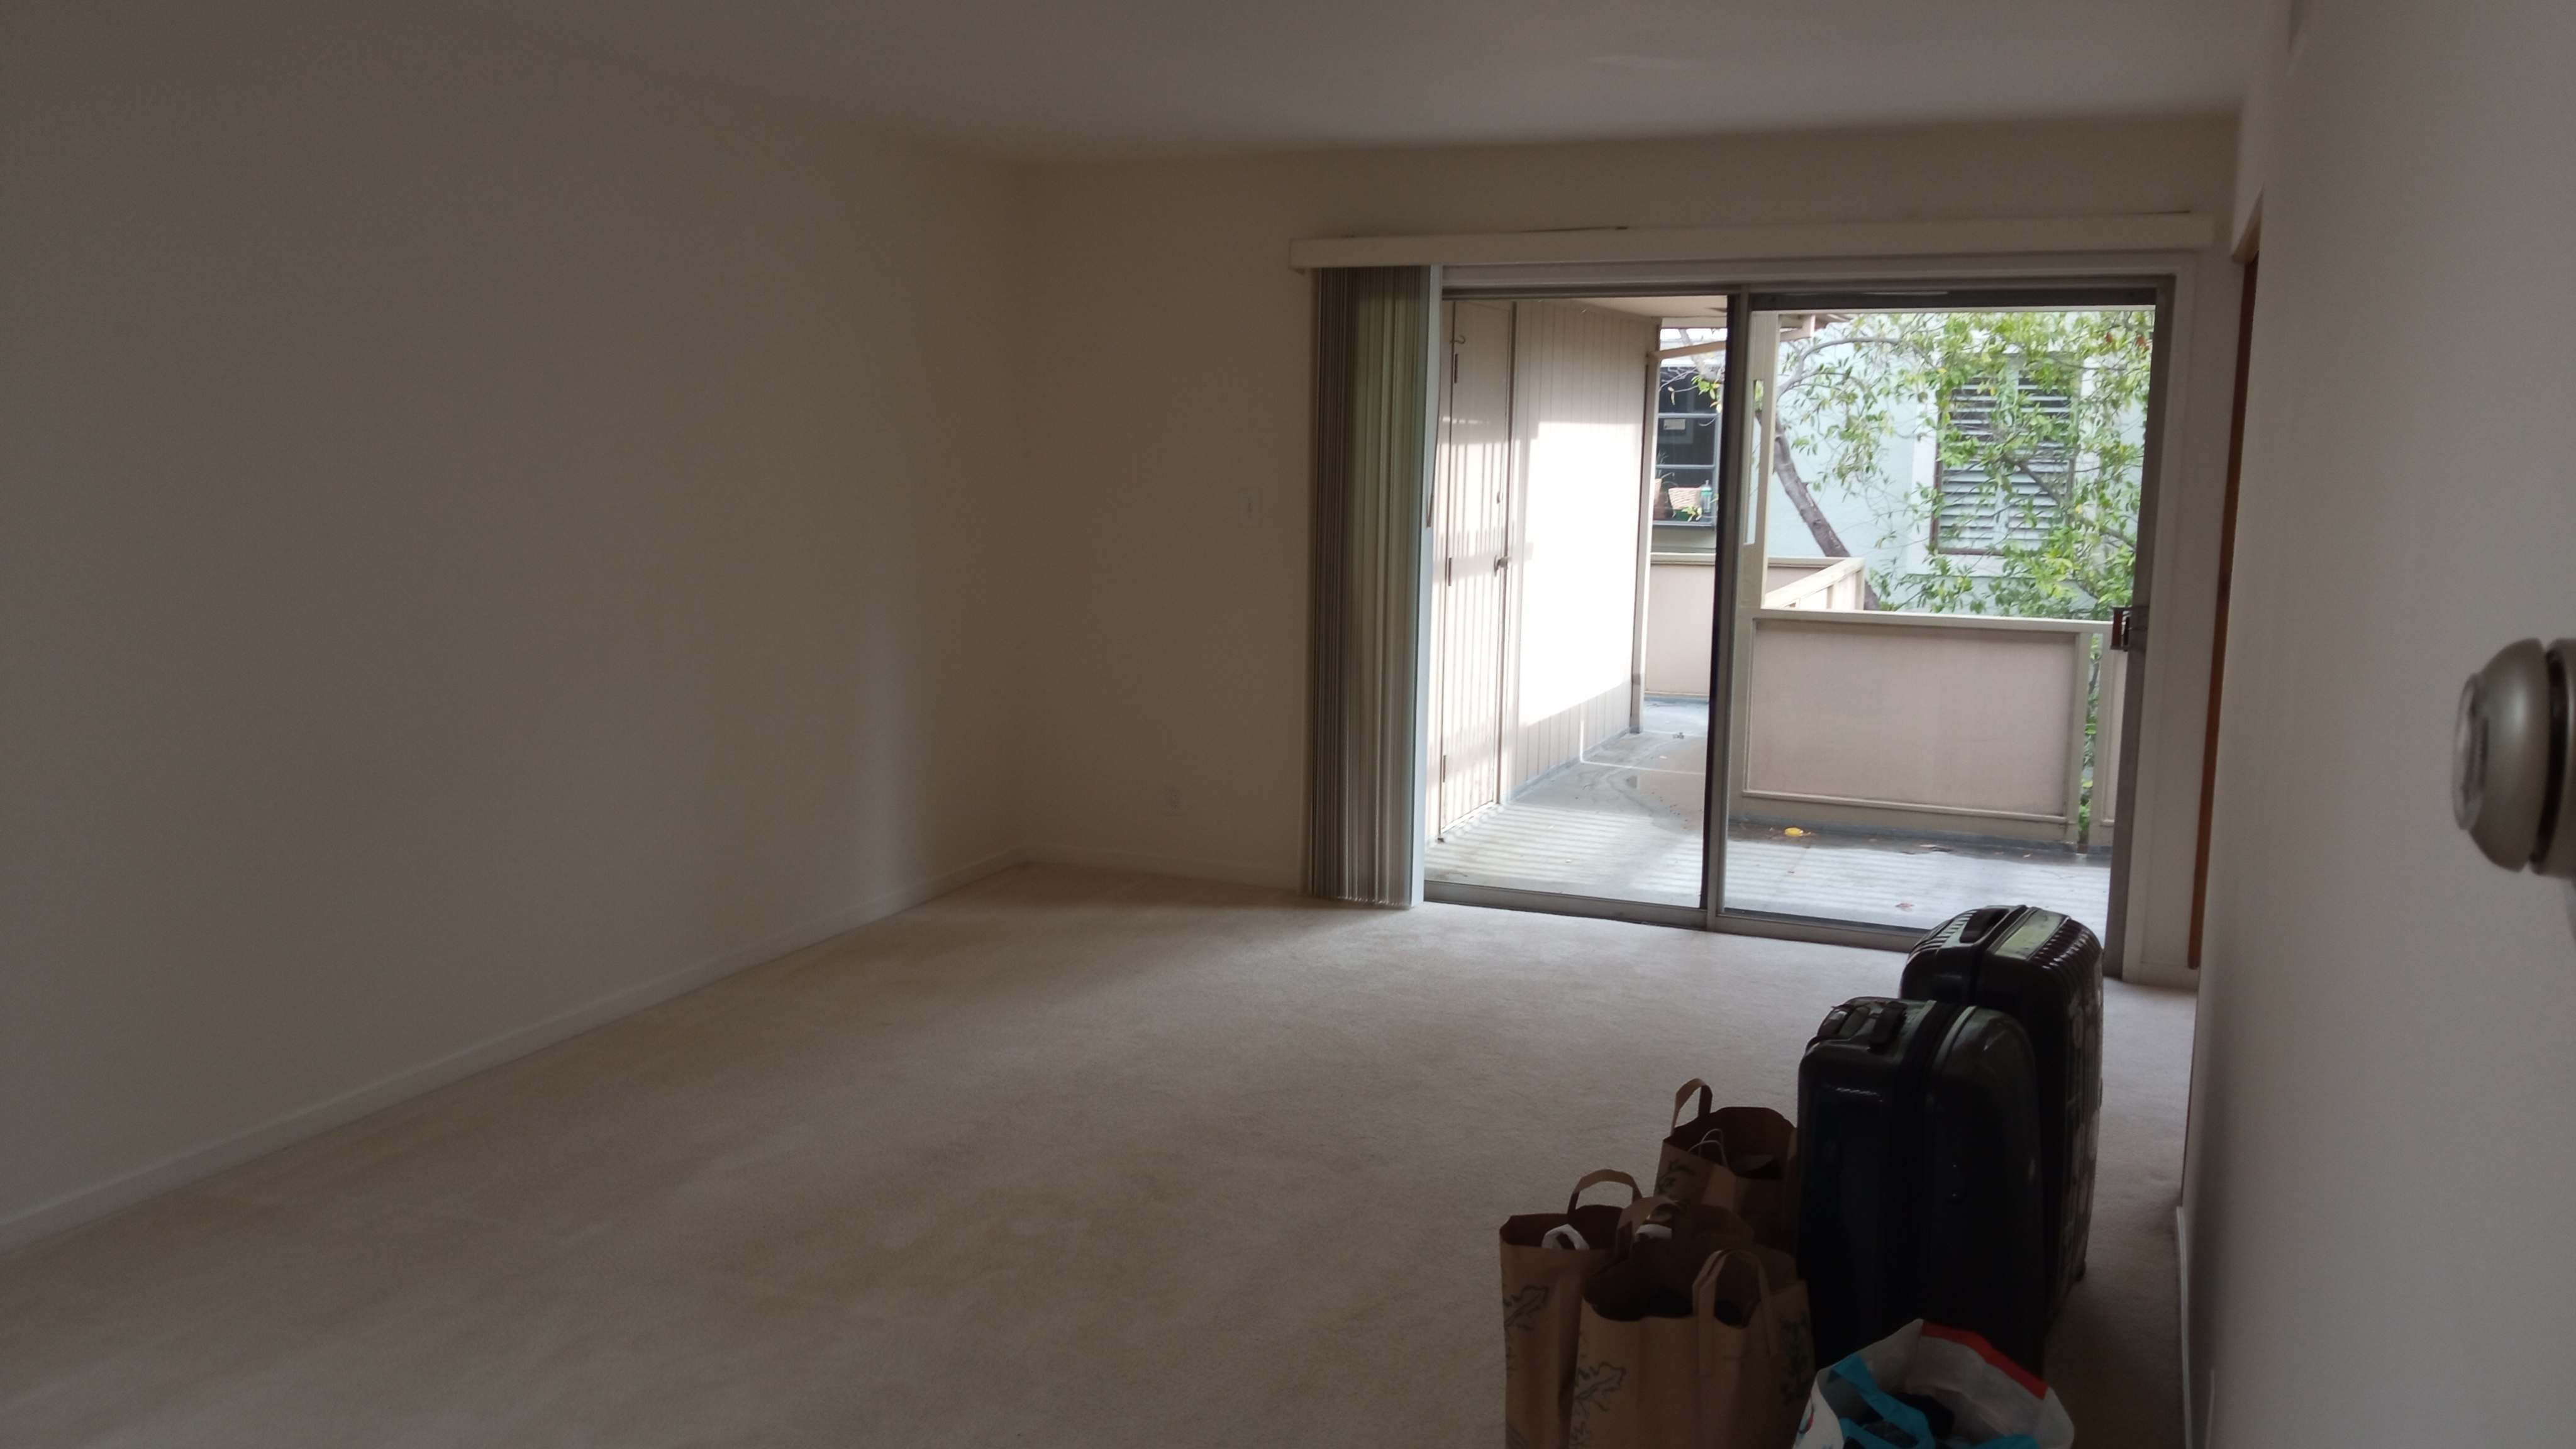 Caption: Picture of our apartment in Webster St. Palo Alto. We just moved in! Exciting time. Time to furnish the place :)
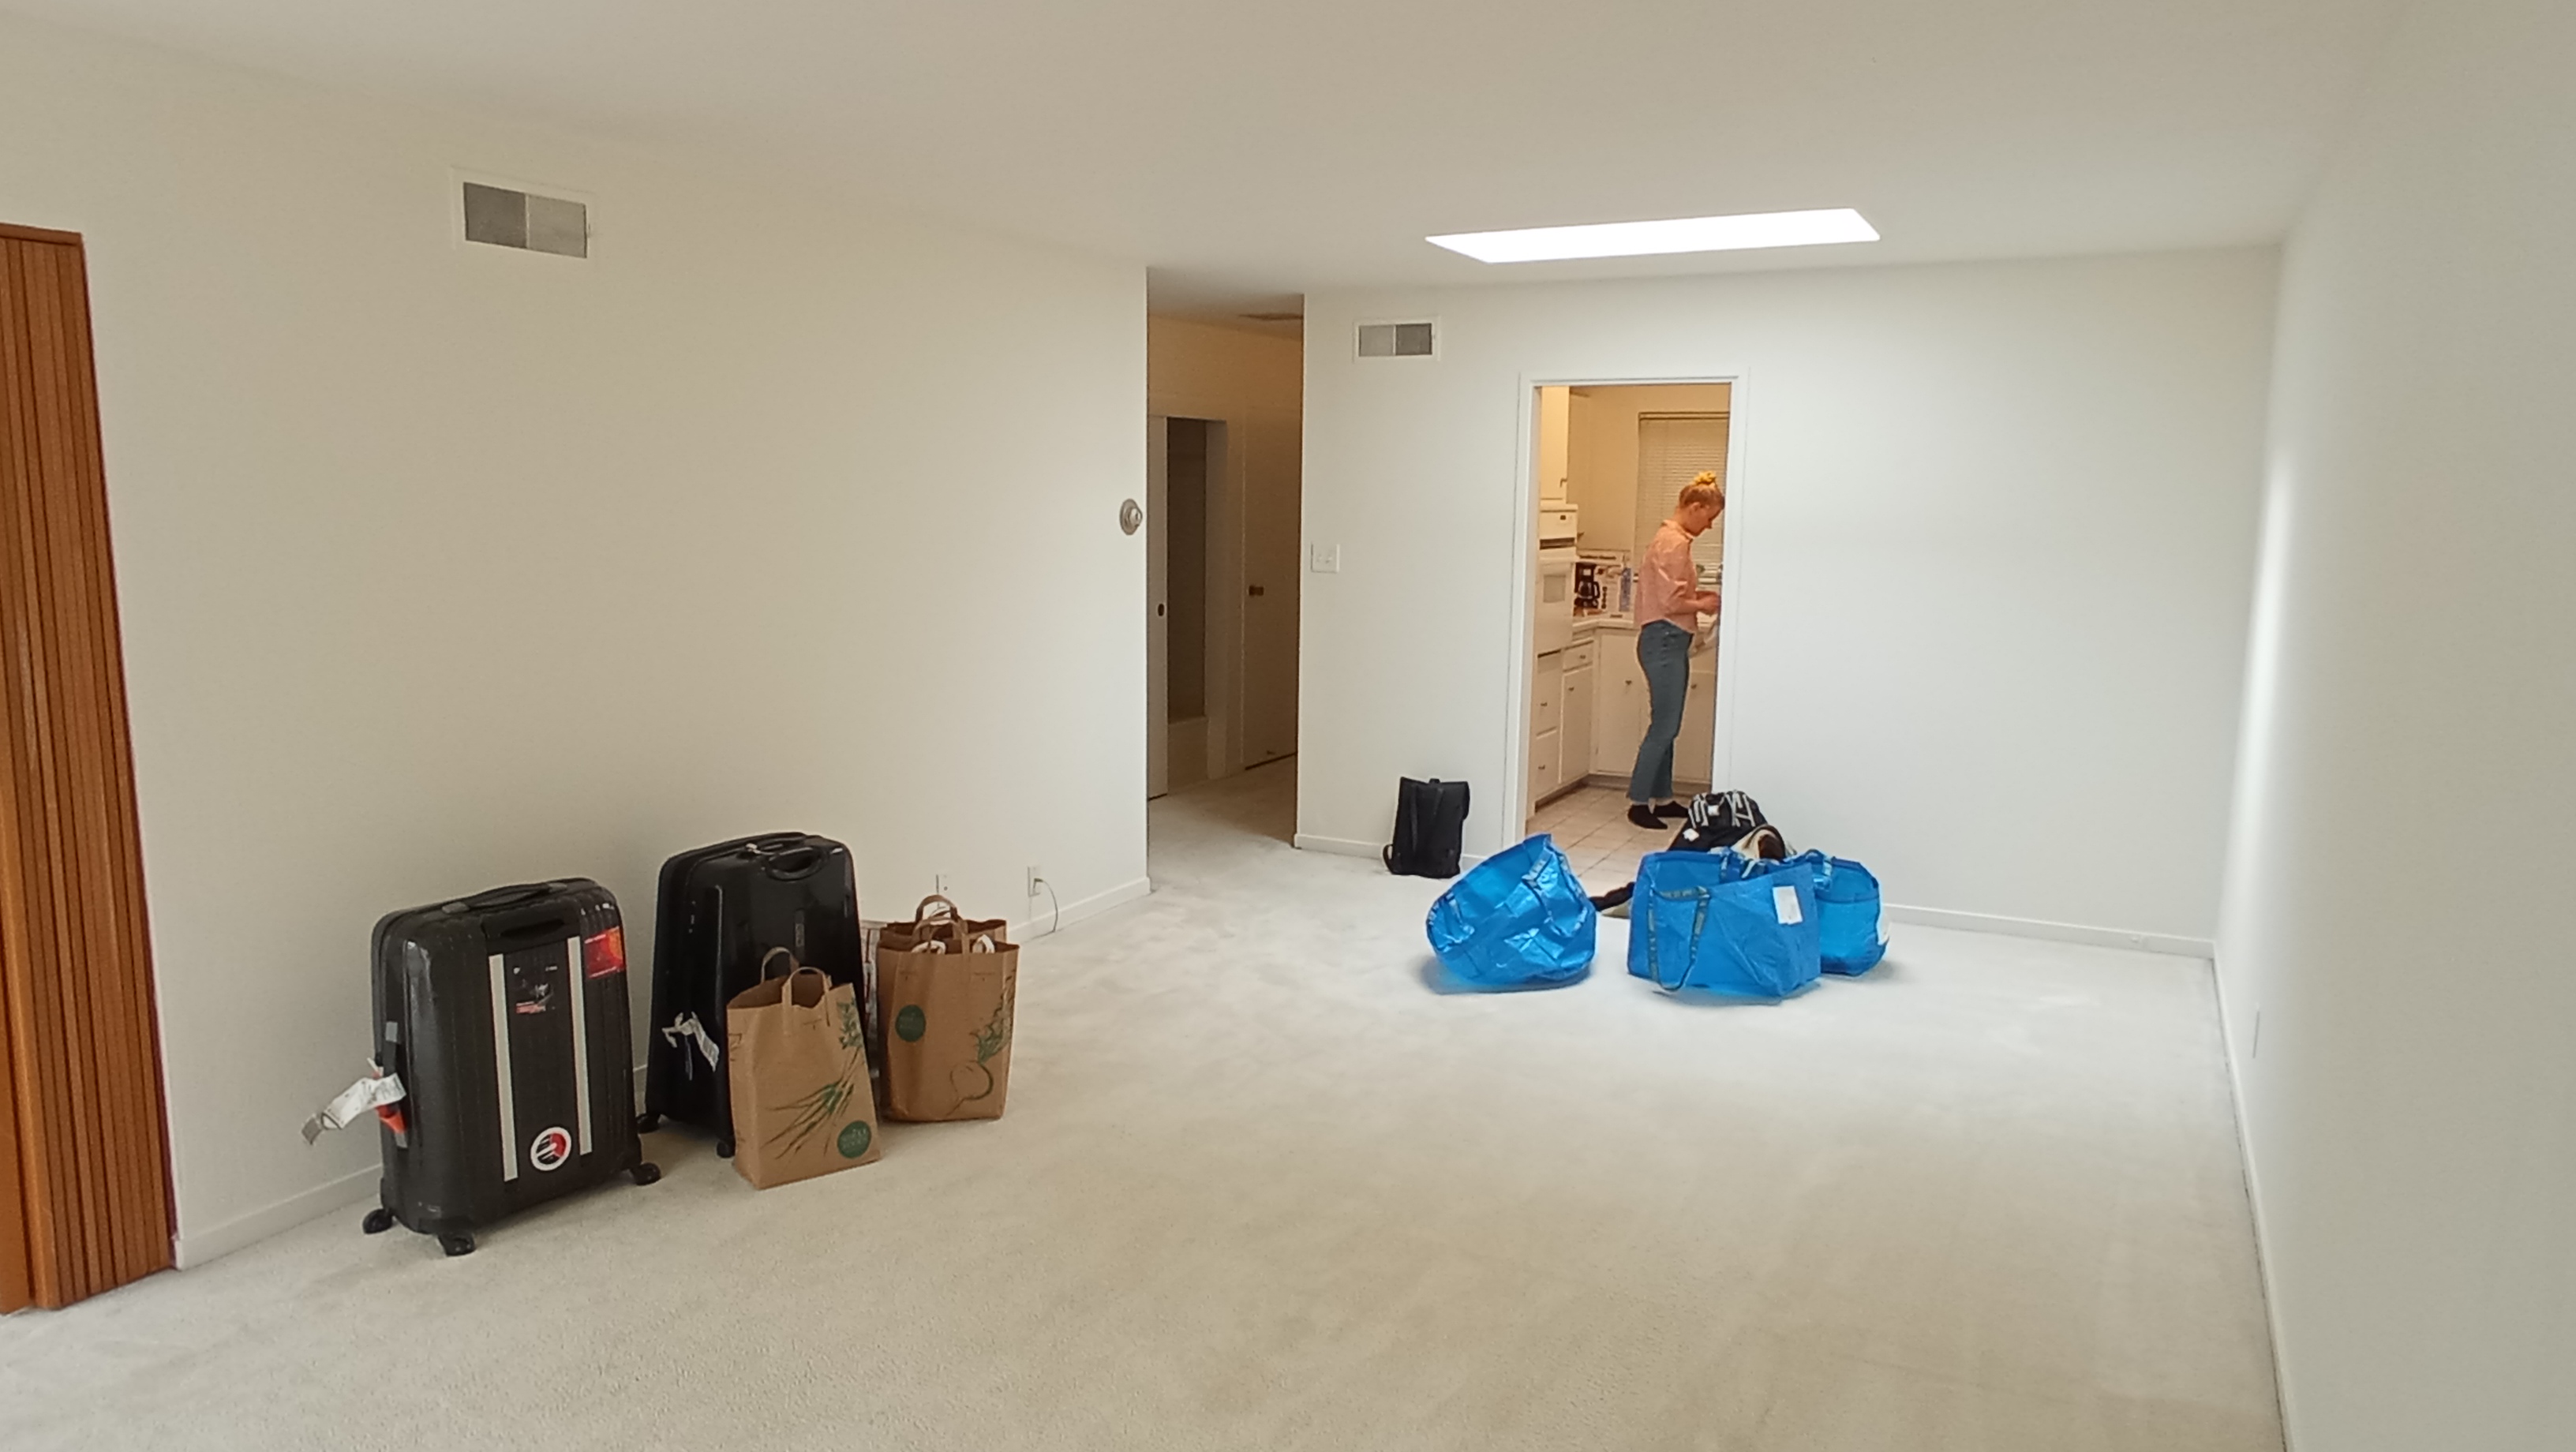
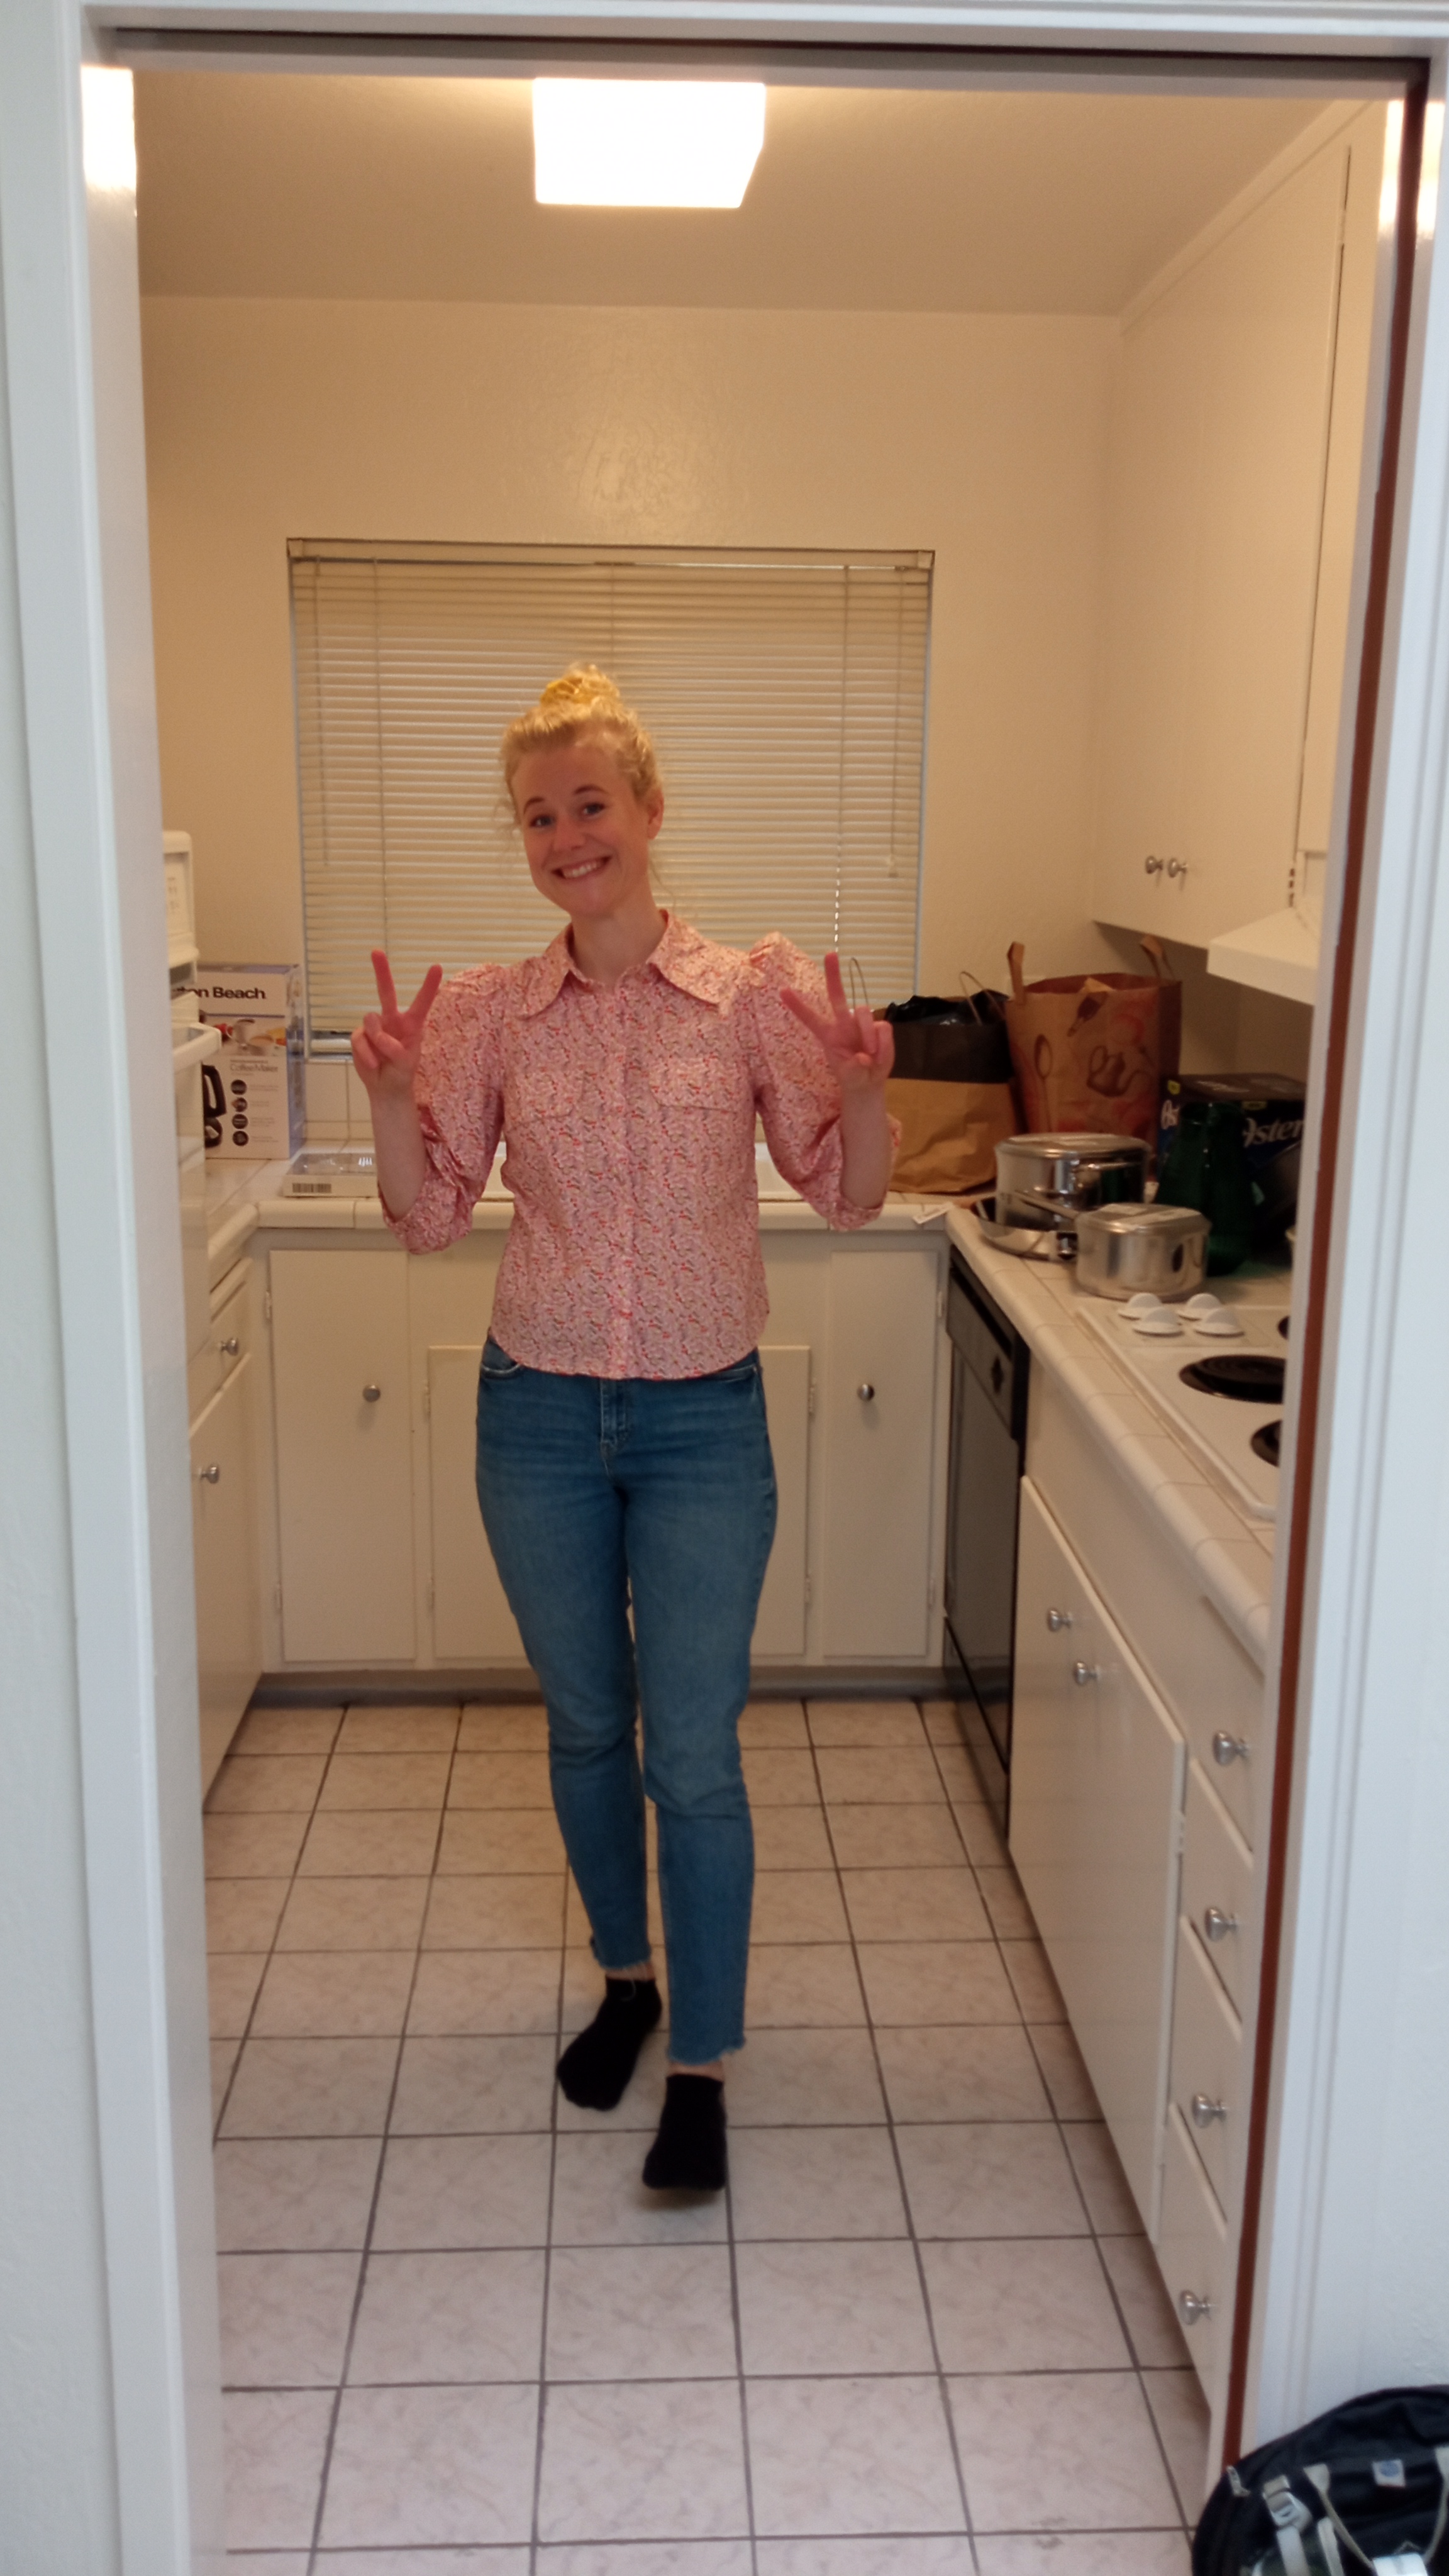
Caption: Siri is in the kitchen. We are unpacking the stuff we bought at IKEA.
Published:
Bonjour guys! The first ten days in the US have been super hectic—exciting but a little overwhelming. After tackling the jet lag (not fun), our first mission was to find an apartment near Stanford University. Spoiler alert: that’s easier said than done. The Bay Area’s reputation for sky-high rents is no exaggeration. Honestly, I wouldn’t have been able to make it here without the generous support of the Norwegian Research Council alongside the Marie Skłodowska-Curie Global grant. Huge thanks to both!
Sure, I could’ve gone the “cheap” route—living in a shared house with 10 other overworked academics (and even that’s not exactly cheap at $1500/month). But, let’s be real, I’ve outgrown that phase. Having my own place is way more practical, especially for when my wife and family visit.
After checking out about ten apartments, we finally found “the one” in Downtown Palo Alto. It’s cozy, just a short bike ride to Stanford, and surprisingly affordable compared to the other options we saw. One week after landing, we had the keys in hand. I’d say we deserve a solid pat on the back for that—go team!
Of course, that was just the beginning of the endless to-do list. We opened a US bank account, wired the deposit and rent from my Norwegian account, and bought two bikes (farewell, rental car). Now we’re biking around—a fun twist in the land of cars. GL HF (good luck, have fun), right?
Next up: internet, a US phone number, a Social Security number, health insurance, and more. Send help! 😅 Take care, and I’ll catch you in the next update. Cheers! 🚴♂️
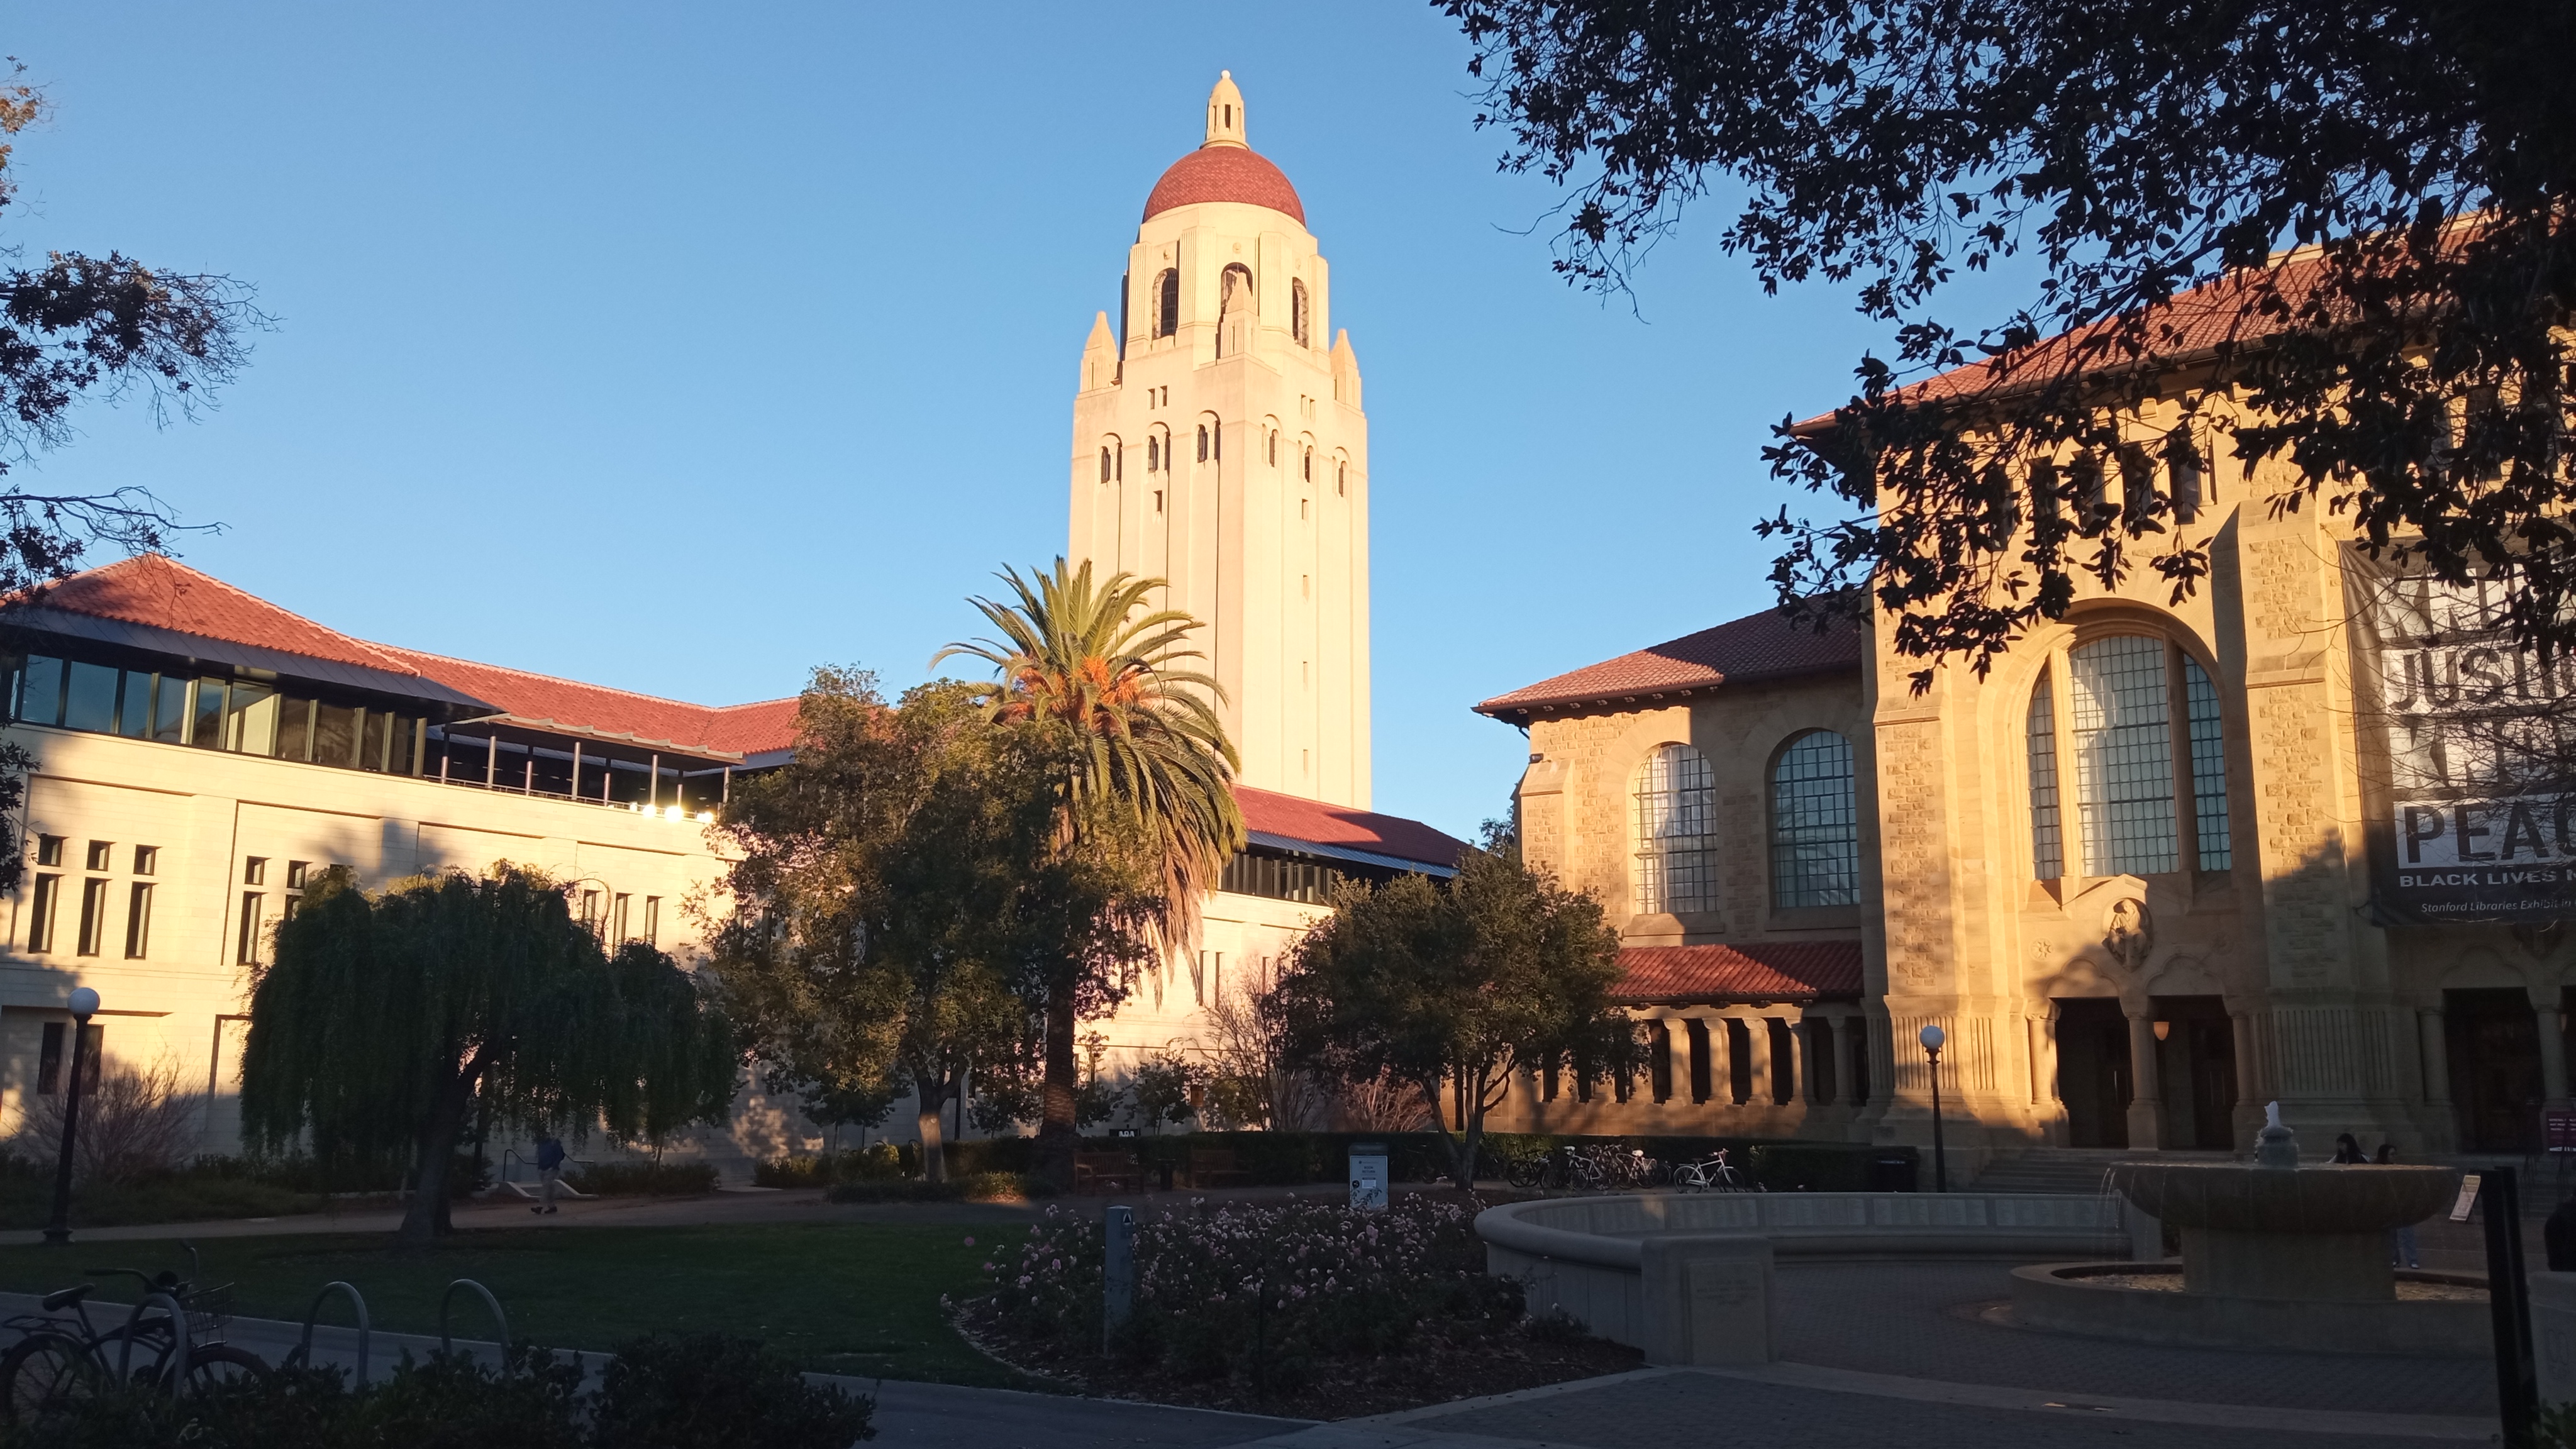 Caption: Picture of Stanford’s campus. It is so beautiful here!
Published:
Hi people, this is the first entry on the blog. Whoop whoop! This marks the beginning of the BOULDERING Marie Skłodowska-Curie Global Fellowship, funded by the European Union (thanks again!). If you’re curious about what a Marie Curie postdoc entails, check out more info here. My fellowship will span three years—two years at Stanford University, followed by a final year at the Department of Geosciences at the University of Oslo. I have no idea what the next three years will hold, but I’m feeling a mix of excitement and nerves. My plan is to share the evolution of the project with you through this blog.
I like to think of this fellowship as my own version of The Fellowship of the Ring. My quest? To conquer three years of planetary research and throw “the One Ring” into Mount Doom—figuratively speaking!
The move to the Bay Area is officially underway. For those unfamiliar, Stanford is about a 45-minute drive southeast of San Francisco, in the southern part of the Bay Area. I’ve been preparing for the transition from Norway to the US over the past few weeks. Having lived in various places—South of France, Svalbard, Oslo, Berlin—moving isn’t new to me. But Oslo has been home for the past decade, so this feels different. A new country, new colleagues, and the challenge of doing well in this role—it’s both exhilarating and nerve-wracking.
The departure date is set: October 2, 2021. My wife, Siri, will join me to help ease the transition. She’s currently doing a postdoc in botany at the Norwegian University of Life Sciences near Oslo, so she’ll be splitting her time between Norway and the US. For the first ten days, we’ll stay in a hotel in Menlo Park, just 5–10 minutes from Stanford, while tackling a mountain of administrative tasks and—most importantly—finding a place to live.
The next entry will be from the US. Here I come, Bay Area! 😊 S
Short description of portfolio item number 1
Short description of portfolio item number 2
Published:
This is a description of your talk, which is a markdown files that can be all markdown-ified like any other post. Yay markdown!
Published:
This is a description of your conference proceedings talk, note the different field in type. You can put anything in this field.
Undergraduate course, University 1, Department, 2014
This is a description of a teaching experience. You can use markdown like any other post.
Workshop, University 1, Department, 2015
This is a description of a teaching experience. You can use markdown like any other post.